did-you-know? rent-now

Amazon no longer offers textbook rentals. We do!

did-you-know? rent-now

Amazon no longer offers textbook rentals. We do!

We're the #1 textbook rental company. Let us show you why.

9781118855218

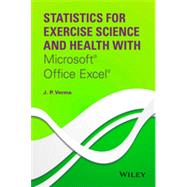
Statistics for Exercise Science and Health With Microsoft Office Excel

by
  • ISBN13:

    9781118855218

  • ISBN10:

    1118855213

  • Edition: 1st
  • Format: Hardcover
  • Copyright: 2014-06-30
  • Publisher: Wiley
  • Purchase Benefits
  • Free Shipping Icon Free Shipping On Orders Over $35!
    Your order must be $35 or more to qualify for free economy shipping. Bulk sales, PO's, Marketplace items, eBooks and apparel do not qualify for this offer.
  • eCampus.com Logo Get Rewarded for Ordering Your Textbooks! Enroll Now
List Price: $171.68 Save up to $0.86
  • Buy New
    $170.82
    Add to Cart Free Shipping Icon Free Shipping

    PRINT ON DEMAND: 2-4 WEEKS. THIS ITEM CANNOT BE CANCELLED OR RETURNED.

Supplemental Materials

What is included with this book?

Summary

This book introduces the use of statistics to solve a variety of problems in exercise science and health and provides readers with a solid foundation for future research and data analysis.

Statistics for Exercise Science and Health with Microsoft Office Excel:

  • Aids readers in analyzing their own data using the presented statistical techniques combined with Excel
  • Features comprehensive coverage of hypothesis testing and regression models to facilitate modeling in sports science
  • Utilizes Excel to enhance reader competency in data analysis and experimental designs
  • Includes coverage of both binomial and poison distributions with applications in exercise science and health
  • Provides solved examples and plentiful practice exercises throughout in addition to case studies to illustrate the discussed analytical techniques
  • Contains all needed definitions and formulas to aid readers in understanding different statistical concepts and developing the needed skills to solve research problems
Author Biography

J. P. Verma, PhD, is Professor of Statistics and Director of the Center for Advanced Studies at Lakshmibai National Institute of Physical Education in Gwalior, India. Professor Verma is an active researcher in sports modeling and data analysis and has conducted many workshops on research methodology, research designs, multivariate analysis, statistical modeling, and data analysis for students of management, physical education, social science, and economics.

Table of Contents

Chapter 1: Scope of Statistics in Exercise Science and Health

Preface

Introduction

Basic Concepts of Statistics

What Statistics Does?

Statistical Processes

Descriptive Process

Comparative Process

Relationship Process

Inferential Process

Predictive Process

Need of Statistics

To understand the literature

To fabricate the research problems

To develop scientific temper

To assess the authenticity of research findings and to contradict the unjustifiable claims

To develop the indices on various characteristics and performances

To develop norms on various traits

To conduct research

Statistics in Exercise Science and Health

Check your progress

Computing with Excel

Installing Analysis ToolPak

Formatting Cell Entries in Excel

Initiating Computation with Excel

Important Definitions

Key Terms

Exercise

Answers

Check your progress

References

Chapter 2: Understanding Nature of Data

Introduction

Important Terminologies

Raw scores

Single scores

Variable and attribute

Independent and Dependent Variable

Continuous and Discrete Variable

Measurement of Data

Nominal Level

Ordinal Level

Interval Level

Ratio Level

Parametric and Non-parametric Statistics

Frequency distribution

Assumptions in Calculating the Statistics from the Grouped Data

Summation Notation

Double Summation

Triple Summation

Measures of central tendency

The Mean

Mean for Raw Data

Mean for Grouped data

Mean for Grouped data using Deviation method

Properties of Mean

Effect of change of Origin and Scale on mean

The Median

Median for ungrouped data

Median for Grouped Data

Properties of Median

The Mode

Mode for Ungrouped Data

Mode for Grouped Data

Properties of mode

Limitations of Mode

Comparison of the Mean, Median and Mode

Check your progress

Practice Exercise

Measures of Variability

The Range

The Quartile Deviation

Quartile Deviation for Ungrouped Data

Quartile Deviation for Grouped Data

Properties of quartile deviation

Drawbacks of quartile deviation

The Mean Deviation

Mean Deviation for Raw Data

Mean Deviation for Grouped Data

Properties of mean deviation

Drawbacks of mean deviation

The Standard Deviation

Standard Deviation for Ungrouped Data

Standard Deviation for Grouped Data

Effect of change of origin and scale on standard deviation

Properties of standard deviation

Grouping Error

Variance

Standard Error

Coefficient of Variation

Absolute and Relative Variability

Box-and-Whisker Plot

Skewness

Percentiles

Check your progress

Practice Exercise

Computing with Excel

Computing Descriptive Statistics With Excel

Key terms

Important definitions

Important formulas

Chapter Exercises

Answers

Check your progress

Chapter Exercise

Chapter 3: Working with Graph

Introduction

Guidelines for constructing the graph

Defining X-Y Axis

Take Origin as Zero

Use Single Vertical Scale

Deciding the Scale Unit

Plotting the Data

Labeling the Graph

Highlighting the Lines

Bar Diagram

Histogram

Frequency polygon

Frequency curve

Cumulative frequency curve

Ogive

Pie diagram

Stem and leaf plot

Check your progress

Practice Exercise

Computing with Excel

Constructing Histogram for Understanding Distribution of the Data

Key terms

Important definitions

Important formulas

Chapter Exercise

Answers

Check your progress

Chapter Exercise

Chapter 4: Probability and its Application

Introduction

Application of Probability

Set Theory

Set

Null Set

Complement

Subset

Operations on Sets

Union

Intersection

Difference

Algebra of Sets

Terminologies used in Probability

Experiment

Sample Space

Event

Elementary Events

Exhaustive cases

Trial

Equally Likely Events

Mutually Exclusive Events

Independent Events

Factorial

Combination

Check your progress

Practice Exercise

Basic Definitions of Probability

Classical Definition of Probability

Empirical Definition of Probability

Subjective Definition of Probability

Axiomatic Definition of Probability

Some Results on Probability

Computing Probability

Types of Probability

Marginal Probability

Union Probability

Joint Probability

Conditional Probability

Theorems of Probability

Law of Addition of Probabilities

Law of Multiplication of Probability

Conditional Probability

Bayes’ Theorem

Check your progress

Practice Exercise

Computing with Excel

Finding the probability

Key terms

Important definitions

Important formulas

Chapter Exercise

Answers

Check your progress

Practice Exercise

Chapter Exercise

Chapter 5: Statistical Distributions and their Application

Introduction

Importance of Statistical Distribution

Terminologies used in Statistical Distribution

Random Variable

Discrete Random Variable

Continuous Random Variable

Probability Distribution Function

Properties of Probability Distribution Function

Probability Density Function

Properties of Probability Density Function

Binomial Experiment

Expectation

Mean and variance of discrete distributions

Mean and variance of continuous distributions

Check your progress

Discrete Distribution

Binomial Distribution

Mean and Standard Deviation of the Binomial distribution

Solving problems using Binomial tables

Poisson distribution

Mean and Standard Deviation of the Poisson distribution

Solving problems using Poisson tables

Check your progress

Practice Exercise

Continuous Distribution

Normal Distribution

Family of Normal Curve

Characteristics of Normal Curve

Standard Normal Distribution

Standard Score

Normal Approximation to the Binomial Distribution

Testing normality of the data

Skewness

Kurtosis

Test for normality

Normal Q-Q plot for normality

The Central Limit Theorem

Solving problems based on normal distribution

How to use standard normal area table

Check your progress

Chapter Exercise

Uses of Normal Distribution

Computing with Excel

Finding the probability

Important formulas

Important Definitions

Chapter Exercises

Answers

Check your progress

Practice Exercise

References

Chapter 6: Sampling and Sampling Distribution

Introduction

Population and sample

Parameter and Statistics

Sampling Frame

Sampling

Advantages of sampling

Census

Probability and Non Probability Sampling

Probability Sampling

Simple Random Sampling

Lottery method

Random number table method

Computer generated method

Features of simple random sampling

Stratified random Sampling

Features of stratified random sampling

Systematic Sampling

Features of stratified random sampling

Cluster Sampling

Features of stratified random sampling

Multistage sampling

Features of Multistage Sampling

Check your progress

Non Probability Sampling

Sequential sampling

Features of Sequential Sampling

Convenience Sampling

Consecutive Sampling

Quota Sampling

Purposive Sampling

Snowball Sampling

When to use the probability sampling

When to use the non probability sampling

Characteristics of good sample

Sources of Data

Primary data

Secondary Data

Methods of data collection

Observation method

Interview method

Questionnaire methods

Experimental method

Biases in data collection

Biases due to procedure

Biases due to sampling

Sampling error

Non sampling errors

Sampling Distribution

Central Limit Theorem

Standard Error

Sampling Distribution of sample mean

Sampling Distribution of Proportion

Check your progress

Criteria in deciding sample size

Cost Factor

Accuracy factor

Practice Exercise

Computing with Excel

Finding random sample using Excel

Important Definitions

Important formulas

Chapter Exercises

Answers

Check your progress

Practice Exercise

References

Chapter 7: Statistical Inference for decision making in Exercise Science and Health

Introduction

Theory of Estimation

Point estimation

Characteristics of a good Estimator

Unbiasedness

Consistency

Efficiency

Sufficiency

The t distribution

Interval estimation

Factors that Affects the Confidence Interval

Confidence Intervals for Population Mean

Confidence Intervals for Population Proportion

Check your progress

Practice Exercise

Testing of Hypothesis

Types of Hypothesis

Null hypothesis

Alternative hypothesis

Test Statistic

Concept Used in Hypothesis Testing

Type I and Type II error

Level of Significance

Power of the test

Rejection region and Critical value

The p-value

One tailed and two tailed test

Degrees of freedom

Strategy in selecting test statistic

Steps in Hypothesis Testing

Finding critical value in z test

Finding critical value in t test

Testing with p-value

One sample testing

Test of Significance about a population mean

With the z Test (σ known)

Test of Significance about a population mean

With the t test (σ unknown)

Test of Significance about a proportion

Test of Significance about a variance

Two samples testing

Test of Significance About The Difference in Two Means: With z-Test for two Independent Samples (σ1 and σ2 Known)

Test of Significance About The Difference in Two Means: With t-Test (σ1 and σ2 Unknown)

Case I: Two sample t-test for Independent Samples

Case II: Paired t-test for two dependent sample

Test of Significance About two Population Proportions

Test of Significance About two Population Variances

Check your progress

Practice Exercise

Computing with Excel

Using Excel in comparing group Means

z-Test for Comparing the Means of two Samples

t-Test for comparing two independent samples

Paired t-test for two dependent samples

Important Definitions

Important formulas

Chapter Exercise

Answers

Check your progress

Practice Exercise

Chapter Exercise

Chapter 8: Analysis of Variance and Designing Research Experiments

Introduction

Understanding Analysis of Variance

Design of Experiment

One way Analysis of Variance

One-way ANOVA Model

Procedure in One-Way ANOVA

Post hoc Tests

LSD Test

Tukey HSD Test

Scheffe’s Test

Assumptions in one-way ANOVA

Using multiple t-tests instead of one way ANOVA

Completely Randomized Design

Example of one-way ANOVA

For Solving Completely Randomized Design

Check your progress

Practice Exercise

Two-way Analysis of Variance (n observations per cell)

Advantages of two-way ANOVA

Terminologies used in Two-Way ANOVA

Factors

Treatment conditions

Main effect

Simple Effect

Interaction effect

Two-way ANOVA model

Procedure in two-way ANOVA

Assumptions in two way Analysis of Variance

Two-way Analysis of Variance (one observation per cell)

Two-way ANOVA model

Procedure in two-way ANOVA(one observation per cell)

Randomized Block Design

Example of Two-way ANOVA with One Observation Per Cell

For Solving Randomized Block Design

Practice Exercise

Factorial Design

Example of Two-way ANOVA with n Observations per Cell

For Solving Factorial Design

Analysis of Covariance

Steps in the analysis of Covariance

Check your progress

Practice Exercise

Computing with Excel

Solving Experimental designs with Excel

Solving Completely Randomized Design(One way ANOVA)

Solving Randomized Block Design(Two-way ANOVA with 1 observation per cell)

Solving Factorial Design(Two-way ANOVA with n observation per cell)

Important Definitions

Important formulas

Chapter Exercise

Answers

Check your progress

Practice Exercise

Chapter Exercise

Reference

Chapter 9: Understanding Relationships and Developing Regression Models

Introduction

Types of relationship

Correlation Coefficient

Testing the significance of correlation coefficient

Interpreting correlation coefficient

Application of correlation coefficient

Effect of change of origin and scale on the correlation coefficient

Limitations of the correlation coefficient

Check your progress

Practice Exercise

Partial correlation

General Formula for Partial Correlation

Limitations of Partial Correlation

Utilities of Partial Correlation

Multiple correlation

Suppression Variable

Check your progress

Practice Exercise

Regression Analysis

Simple Regression Analysis

Alternate formula of intercept and slope

Computing intercept and slope in a simple regression analysis

Analyzing the residuals

Residual Plot

Testing assumptions in the regression model

Standard error of estimate

Testing the significance of slope

Testing the significance of model

Coefficient of Determination (R2)

Check your progress

Practice Exercise

The Multiple Regression model

Procedure of developing the regression equation with two independent variables

Developing a Multiple Regression Model

Standardized regression coefficients

Different ways of testing a regression model

Testing the significance of overall model

Testing the significance of regression coefficients

Analyzing the residuals

Standard Error of the Estimate

The coefficient of determination(R2)

Adjusted R2

Testing the significance of R2

Law of Diminishing Return

Different approaches in developing multiple regression model

Stepwise Regression

Forward Regression

Backward Regression

Enter method

Check your progress

Practice Exercise

Computing with Excel

Computing Correlation Matrix in Excel

Regression Analysis with Excel

Important Definitions

Important formulas

Chapter Exercise

Answers

Check your progress

Practice Exercise

Chapter Exercise

Reference

Chapter 10: Statistical Tests for Non Parametric Data

Introduction

Merits and demerits of Non parametric tests

Chi-square Test

Application of Chi-square test

Assumptions in Chi-Square test

Testing Goodness of Fit

Test for Independence of Attributes

Yates Correction

Additive Property of Chi-Square

Check your progress

Runs Test

Test Statistic

Critical value

Decision rule

Large Sample size

Check your progress

Practice Exercise

Mann-Whitney U test for two Samples

Test Statistic

Critical value

Decision rule

Large Sample size

Wilcoxon Match-Pairs Signed Ranks Test

Test Statistic

Critical value

Decision rule

Large Sample size

Kruskal Wallis Test (One-Way ANOVA for Non-Parametric Data)

Test Statistic

Critical value

Decision rule

The Friedman test

Test Statistic

Critical value

Decision rule

Check your progress

Practice Exercise

Computing with Excel

Computing Chi Square with Excel

Important definitions

Important Formulas

Chapter Exercise

Answers

Check your progress

Practice exercise

Chapter Exercise

Bibliography

Chapter 11: Measuring Associations in non parametric data

Introduction

Rank Correlation: Measure of association between ranked data

Assumptions

Testing significance

Merits and demerits

Bi-serial Correlation: measure of association between dichotomous and continuous variable

Assumptions

Testing significance

Merits and demerits

Point Bi-serial Correlation: measure of correlation between true dichotomous and continuous variable Testing significance

Check your progress

Tetrachoric correlation: measure of association between dichotomous variables

Assumptions

Testing significance

Merits and demerits

Phi Coefficient: measure of association between naturally dichotomous variables

Assumptions

Testing significance

Merits and demerits

Contingency coefficient: measure of association between any categorical variables

Merits and demerits

Check your progress

Practice exercise

Computing with Excel

Computing Rank Correlation with Excel

Important definitions

Important formulas

Chapter Exercise

Answers

Check your progress

Practice exercise

Chapter Exercise

References

Chapter 12: Developing Norms For Assessing Performance

Introduction

Percentiles

Merits and Demerits of the Percentile Scale

Percentile Rank

Z-scale

Merits and Demerits of Z Scale

T-scale

Stanine Scale

Composite Scale Based on Z-Score

Conditions for using Z-score

Check your progress

Practice Exercise

Scaling of Ratings in Terms of Normal Curve

Developing Norms Based Upon Difficulty Ratings

Computing with Excel

Computing Z and T scores with Excel

Important Definitions

Important formulas

Chapter Exercise

Answers

Check your progress

Practice exercise

Chapter Exercise

Appendix: Tables

Table A.1: Trigonometric functions

Table A.2: Binomial Probability Distribution

Table A.3:Poisson Probability Distribution

Table A.4:Normal curve area table

Table A.5: Ordinates of the distribution of normal deviate

Table A.6:Standard scores and ordinates corresponding to divisions of the area under the normal curve into a larger proportion (B) and a smaller proportion (C)

Table A.7:Critical values of t-distribution

Table A.8: Critical values of the correlation coefficient

Table A.9: Critical values of F-distribution at .05 level of significance

Table A.10:Critical values of F-distribution at .01 level of significance

Table A.11:Critical Values of Chi-square distribution

Table A.12:Critical Values of R in the Runs test

Table A.13: Critical Values of U in Mann-Whitney Test

Table A.14:Critical value of T for the Wilcoxon matched-pairs signed-ranks test (Small Samples)

Supplemental Materials

What is included with this book?

The New copy of this book will include any supplemental materials advertised. Please check the title of the book to determine if it should include any access cards, study guides, lab manuals, CDs, etc.

The Used, Rental and eBook copies of this book are not guaranteed to include any supplemental materials. Typically, only the book itself is included. This is true even if the title states it includes any access cards, study guides, lab manuals, CDs, etc.

Rewards Program