did-you-know? rent-now

Amazon no longer offers textbook rentals. We do!

did-you-know? rent-now

Amazon no longer offers textbook rentals. We do!

We're the #1 textbook rental company. Let us show you why.

9781408191880

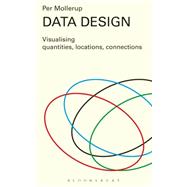
Data Design Visualising Quantities, Locations, Connections

by
  • ISBN13:

    9781408191880

  • ISBN10:

    1408191881

  • Format: Hardcover
  • Copyright: 2015-07-16
  • Publisher: Bloomsbury Visual Arts
  • Purchase Benefits
  • Free Shipping Icon Free Shipping On Orders Over $35!
    Your order must be $35 or more to qualify for free economy shipping. Bulk sales, PO's, Marketplace items, eBooks and apparel do not qualify for this offer.
  • eCampus.com Logo Get Rewarded for Ordering Your Textbooks! Enroll Now
List Price: $150.00
We're Sorry.
No Options Available at This Time.

Summary

Data Design: Visualising quantities, locations, connections is a lively and comprehensive introduction to data visualisation, illustrated with 199 instructive data displays. The book is for designers, journalists, editors, writers and anyone concerned with presenting factual information in a clear and effective way.

Data Design highlights the key qualities of good data visualisation: accuracy, simplicity, and clarity. In this spirit, Per Mollerup discusses information design with great clarity. The proposed data displays are as simple as possible, and every graphic element is there to convey meaning. This book is not about data decoration.

Data Design can be read from cover to cover, but it doesn't have to be. It can also serve as a reference guide. Each of the data displays included is explained in such a way as to clarify the problems to be addressed and the method by which to address them, enabling the reader to develop the skills with which to improve their data visualisation designs.
Author Biography

Per Mollerup is Professor of Communication Design at Swimburn University of Technology, Melbourne, Australia. His previous positions include Professor in Design, Olso National Academy of the Arts, Olso and Managing Director of Deisgnlab A/S, a creative design studio. He is the author of several books on design.

Table of Contents

Introduction
Organizing knowledge / Goals/ Benefits/ Information graphics/ Simplicity/ Historical snapshots/ Beware of visual displays
Basics
Research and common sense/ Gestalt principles of perception/ Psychological principles/ Colour
Notation/ Reading visual displays/ Choice of display
Quantities
Intro/ Variables/ Pie charts/ Vertical bar charts/ Horizontal bar charts/ Divided bar charts/ Stacked bar charts/ Step charts/ Line charts/ Layer charts/ Radar charts/ Scatter plots/ Picture tables/ Isotype
Locations
Intro/ Geographical maps/ Thematic maps/ Map scale/ Map projection/ The geographical coordinate system/ Map orientation/ Map symbols/ Visual variables/ Map generalization/ The process of map making/ Choropleth maps/ Isopleth maps/ Contour line maps/ Cartograms/ You-Are-Here maps/ Transit maps
Connections
Intro/ Trees / Mind maps/ Positioning maps/ Timelines/ Flow charts/ Concept maps/ Venn diagrams / Carroll diagrams/ Euler diagrams
Definitions
Index
Sources

Supplemental Materials

What is included with this book?

The New copy of this book will include any supplemental materials advertised. Please check the title of the book to determine if it should include any access cards, study guides, lab manuals, CDs, etc.

The Used, Rental and eBook copies of this book are not guaranteed to include any supplemental materials. Typically, only the book itself is included. This is true even if the title states it includes any access cards, study guides, lab manuals, CDs, etc.

Rewards Program