did-you-know? rent-now

Amazon no longer offers textbook rentals. We do!

did-you-know? rent-now

Amazon no longer offers textbook rentals. We do!

We're the #1 textbook rental company. Let us show you why.

9780071837262

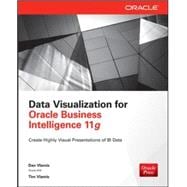
Data Visualization for Oracle Business Intelligence 11g

by ;
  • ISBN13:

    9780071837262

  • ISBN10:

    0071837264

  • Edition: 1st
  • Format: Paperback
  • Copyright: 2015-02-12
  • Publisher: McGraw Hill

Note: Supplemental materials are not guaranteed with Rental or Used book purchases.

Purchase Benefits

  • Free Shipping Icon Free Shipping On Orders Over $35!
    Your order must be $35 or more to qualify for free economy shipping. Bulk sales, PO's, Marketplace items, eBooks and apparel do not qualify for this offer.
  • eCampus.com Logo Get Rewarded for Ordering Your Textbooks! Enroll Now
List Price: $60.00 Save up to $15.00
  • Buy Used
    $45.00
    Add to Cart Free Shipping Icon Free Shipping

    USUALLY SHIPS IN 2-4 BUSINESS DAYS

Supplemental Materials

What is included with this book?

Summary

Design and Deliver Effective Visual Solutions of BI Data

Cowritten by an Oracle ACE Director and an expert in data visualization design specializing in BI and analytics, Data Visualization for Oracle Business Intelligence 11g reveals best practices for presenting data-driven insights with graphs, tables, maps, dashboards, and other methods that will immediately enhance corporate decision-making. Throughout the book, the principles of effective design are emphasized. Leverage the power of this comprehensive business intelligence platform to deliver rich visualizations of business information across the enterprise.

  • Create well-organized tables and pivot tables
  • Convey data insights with line, bar, pie, waterfall, radar, and other graphs
  • Configure MapViews so that you can provide interactive maps and spatial analysis capabilities
  • Build advanced visualizations, including trellis charts, gauges, R images, jQuery sparklines, and more
  • Use Oracle Business Intelligence Publisher to create pixel-perfect reports from various data sources
  • Design effective, interactive BI dashboards
  • Use the Oracle Scorecard and Strategy Management module to measure, evaluate, and manage key performance indicators
  • Make smart color choices using data science tools
Supplemental Materials

What is included with this book?

The New copy of this book will include any supplemental materials advertised. Please check the title of the book to determine if it should include any access cards, study guides, lab manuals, CDs, etc.

The Used, Rental and eBook copies of this book are not guaranteed to include any supplemental materials. Typically, only the book itself is included. This is true even if the title states it includes any access cards, study guides, lab manuals, CDs, etc.

Rewards Program