did-you-know? rent-now

Amazon no longer offers textbook rentals. We do!

did-you-know? rent-now

Amazon no longer offers textbook rentals. We do!

We're the #1 textbook rental company. Let us show you why.

9780205728275

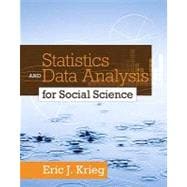
Statistics and Data Analysis for Social Science

by
  • ISBN13:

    9780205728275

  • ISBN10:

    0205728278

  • Edition: 1st
  • Format: Paperback
  • Copyright: 2011-02-22
  • Publisher: Pearson
  • Purchase Benefits
  • Free Shipping Icon Free Shipping On Orders Over $35!
    Your order must be $35 or more to qualify for free economy shipping. Bulk sales, PO's, Marketplace items, eBooks and apparel do not qualify for this offer.
  • eCampus.com Logo Get Rewarded for Ordering Your Textbooks! Enroll Now
List Price: $166.65

Summary

For a one-semester, undergraduate introductory course in social statistics. #xA0; Statistical tools for understanding the social world. #xA0; This first edition text seeks to answer the question, universally asked by the social science student, #x1C;Why statistics?#x1D; The author introduces only those statistical concepts that are necessary to understand, interpret, and present social science research.#xA0; All concepts are introduced in the context of a social science application, and strong emphasis is placed on demonstrating what data #x1C;looks like,#x1D; as opposed to giving theoretical explanations. Complexity of calculations is reduced to those elements necessary for understanding the statistical concept.#xA0; Optional technology use is paired with the core elements of the course, making this text a pragmatic and engaging introduction to the practice of social statistics.

Author Biography

Eric J. Krieg is an Associate Professor of Sociology at Buffalo State College in Buffalo, NY. In addition to statistics, he teaches courses on research methods, social problems, theory, and globalization. An environmental sociologist, his work in the field of environmental justice and the unequal distribution of ecological hazards appears in numerous journals. A more recent area of interest is the sociology of food and food systems with an emphasis on milk production and the alternative dairy movement.

Table of Contents

IN THIS SECTION:

1.) BRIEF TABLE OF CONTENTS

2.) FULL TABLE OF CONTENTS


BRIEF TABLE OF CONTENTS:


Chapter 1: Concepts, Variables, and Measurement

Chapter 2: Frequency Tables Introduction

Chapter 3: Measures of Central Tendency

Chapter 4: Measures of Dispersion

Chapter 5: Probability and the Normal Curve Introduction

Chapter 6: Probability- From Samples to Statistics

Chapter 7: Crosstabulation Tables and Chi-Square (X 2)

Chapter 8: Measures of Association for Categorical Variables 

Chapter 9: Analysis of Variance (ANOVA)

Chapter 10: Correlation and Regression


COMPREHENSIVE TABLE OF CONTENTS:


Chapter 1: Concepts, Variables, and Measurement

                        Introduction

                        Concepts

                        Why Statistics?

                        Variables

                        Independent and Dependent Variables

                        Measurement

                        Graphical Representation of Data (What Data “look” Like)

                        Validity and Reliability

                        Individual Data

                        Ecological Data

                        Chapter Summary


Chapter 2: Frequency Tables

                        Introduction

                        Toxic Waste and “Superfund”

                        Frequency Tables

                        Superfund Sites: Frequency Table for a Nominal Variable 

                        Frequency Table for an Ordinal Variable

                        Frequency Table for an Interval/Ratio Variable

                        Chapter Summary


Chapter 3: Measures of Central Tendency

                        Introduction

                        Averages and Energy Consumption

                        Definitions of Mode, Median, and Mean

                        Calculating Measures of Central Tendency with Raw Data

                        Calculating Measures of Central Tendency with Grouped Data

                        Chapter Summary


Chapter 4: Measures of Dispersion

                        Introduction

                        The Distribution of Education in the U.S.

                        Range

                        Interquartile Range

                        Mean Deviation

                        Variance and Standard Deviation

                        Variance (S²)

                        Standard Deviation (S) 

                        Standard Deviation and the Normal Curve

                        Chapter Summary


Chapter 5: Probability and the Normal Curve

                        Introduction

                        Intelligence, Life Chances, and Inequality

                        The Fundamentals of Probability

                        Probability Using Frequency Tables

                        Probability and the Normal Curve

                        Using Z-Scores to Find Percentiles

                        Chapter Summary


Chapter 6: Probability- From Samples to Statistics

                        Introduction

                        The Politics of Sampling: Global Warming and Political Party

                        Sampling and Statistics

                        The Standard Error of the Mean

                        The Standard Error of the Proportion

                        Other Confidence Intervals

                        The t Distribution

                        Hypotheses and Testing Differences between Means

                        Potential Errors: Type I and Type II

                        Chapter Summary


Chapter 7: Crosstabulation Tables and Chi-Square (X 2)

                         Introduction

                        The “Environmental Decade” and Environmentalism

                        Data Presented in Crosstabulation Tables

                        Crosstabulation and The Chi-Square Test of Statistical Significance (X 2)

                        Chapter Summary


Chapter 8: Measures of Association for Categorical Variables

                        Introduction

                        Social Institutions and Social Control

                        Nominal Measures of Association

                        Ordinal Measures of Association

                        Chapter Summary


Chapter 9: Analysis of Variance (ANOVA)

                        Introduction

                        Smoking on Campus

                        ANOVA

                        Chapter Summary


Chapter 10: Correlation and Regression

                        Introduction

                        Unequal America

                        Scatterplots: The Underlying Logic behind Correlation

                        Correlation

                        Linear Regression

                        Chapter Summary


Appendix A: Statistical Tables

Appendix B: Data Sets

Appendix C: Getting Started Guide for SPSS

Appendix D: Answers to Odd-Numbered Exercises

Supplemental Materials

What is included with this book?

The New copy of this book will include any supplemental materials advertised. Please check the title of the book to determine if it should include any access cards, study guides, lab manuals, CDs, etc.

The Used, Rental and eBook copies of this book are not guaranteed to include any supplemental materials. Typically, only the book itself is included. This is true even if the title states it includes any access cards, study guides, lab manuals, CDs, etc.

Rewards Program