did-you-know? rent-now

Amazon no longer offers textbook rentals. We do!

did-you-know? rent-now

Amazon no longer offers textbook rentals. We do!

We're the #1 textbook rental company. Let us show you why.

9780321986498

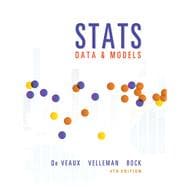
Stats Data and Models

by ; ;
  • ISBN13:

    9780321986498

  • ISBN10:

    0321986490

  • Edition: 4th
  • Format: Hardcover
  • Copyright: 2014-12-24
  • Publisher: Pearson
  • View Upgraded Edition

Note: Supplemental materials are not guaranteed with Rental or Used book purchases.

Purchase Benefits

  • Free Shipping Icon Free Shipping On Orders Over $35!
    Your order must be $35 or more to qualify for free economy shipping. Bulk sales, PO's, Marketplace items, eBooks and apparel do not qualify for this offer.
  • eCampus.com Logo Get Rewarded for Ordering Your Textbooks! Enroll Now
  • Buyback Icon We Buy This Book Back!
    In-Store Credit: $1.05
    Check/Direct Deposit: $1.00
List Price: $226.65 Save up to $213.13
  • Rent Book $34.00
    Add to Cart Free Shipping Icon Free Shipping

    TERM
    PRICE
    DUE
    IN STOCK USUALLY SHIPS IN 24 HOURS.
    HURRY! ONLY 2 COPIES IN STOCK AT THIS PRICE
    *This item is part of an exclusive publisher rental program and requires an additional convenience fee. This fee will be reflected in the shopping cart.

Supplemental Materials

What is included with this book?

Summary

NOTE: You are purchasing a standalone product; MyStatLab does not come packaged with this content. If you would like to purchase both the physical text and MyStatLab search for:

0133956490 / 9780133956498                Stats: Data and Models Plus NEW MyStatLab with Pearson eText -- Access Card Package 

Package consists of:  

0321847997 / 9780321847997                My StatLab Glue-in Access Card

032184839X / 9780321848390                MyStatLab Inside Sticker for Glue-In Packages

0321986490 / 9780321986498                Stats: Data and Models


MyStatLab should only be purchased when required by an instructor.


For one-or-two semester introductory statistics courses.


Richard De Veaux, Paul Velleman, and David Bock wrote Stats: Data and Models with the goal that students and instructors have as much fun reading it as they did writing it. Maintaining a conversational, humorous, and informal writing style, this new edition engages students from the first page. The authors focus on statistical thinking throughout the text and rely on technology for calculations. As a result, students can focus on developing their conceptual understanding. Innovative Think/Show/Tell examples give students a problem-solving framework and, more importantly, a way to think through any statistics problem and present their results. The Fourth Edition is updated with instructor podcasts, video lectures, and new examples to keep material fresh, current, and relevant to today’s students.
 

Author Biography

Richard D. DeVeaux is an internationally known educator and consultant. He has taught at the Wharton School and the Princeton University School of Engineering, where he won a “Lifetime Award for Dedication and Excellence in Teaching.” Since 1994, he has been Professor of Statistics at Williams College. Dick has won both the Wilcoxon and Shewell awards from the American Society for Quality. He is a fellow of the American Statistical Association (ASA) and an elected member of the International Statistical Institute (ISI). In 2008, he was named Statistician of the Year by the Boston Chapter of the ASA. Dick is also well known in industry, where for more than 25 years he has consulted for such Fortune 500 companies as American Express, Hewlett-Packard, Alcoa, DuPont, Pillsbury, General Electric, and Chemical Bank. Because he consulted with Mickey Hart on his book Planet Drum, he has also sometimes been called the “Official Statistician for the Grateful Dead.” His real-world experiences and anecdotes illustrate many of this book’s chapters.


Dick holds degrees from Princeton University in Civil Engineering (B.S.E.) and Mathematics (A.B.) and from Stanford University in Dance Education (M.A.) and Statistics (Ph.D.), where he studied dance with Inga Weiss and Statistics with Persi Diaconis. His research focuses on the analysis of large data sets and data mining in science and industry.


In his spare time, he is an avid cyclist and swimmer. He also is the founder of the “Diminished Faculty,” an a cappella Doo-Wop quartet at Williams College and sings bass in the college concert choir. Dick is the father of four children.


Paul F. Velleman has an international reputation for innovative Statistics education. He is the author and designer of the multimedia Statistics program ActivStats, for which he was awarded the EDUCOM Medal for innovative uses of computers in teaching statistics, and the ICTCM Award for Innovation in Using Technology in College Mathematics. He also developed the award-winning statistics program, Data Desk, and the Internet site Data and Story Library (DASL) (lib.stat.cmu.edu/DASL/), which provides data sets for teaching Statistics. Paul’s understanding of using and teaching with technology informs much of this book’s approach.


Paul has taught Statistics at Cornell University since 1975. He holds an A.B. from Dartmouth College in Mathematics and Social Science, and M.S. and Ph.D. degrees in Statistics from Princeton University, where he studied with John Tukey. His research often deals with statistical graphics and data analysis methods. Paul co-authored (with David Hoaglin) ABCs of Exploratory Data Analysis. Paul is a Fellow of the American Statistical Association and of the American Association for the Advancement of Science. Paul is the father of two boys.


David E. Bock taught mathematics at Ithaca High School for 35 years. He has taught Statistics at Ithaca High School, Tompkins-Cortland Community College, Ithaca College, and Cornell University. Dave has won numerous teaching awards, including the MAA’s Edyth May Sliffe Award for Distinguished High School Mathematics Teaching (twice), Cornell University’s Outstanding Educator Award (three times), and has been a finalist for New York State Teacher of the Year.


Dave holds degrees from the University at Albany in Mathematics (B.A.) and Statistics/Education (M.S.). Dave has been a reader and table leader for the AP Statistics exam, serves as a Statistics consultant to the College Board, and leads workshops and institutes for AP Statistics teachers. He has recently served as K–12 Education and Outreach Coordinator and a senior lecturer for the Mathematics Department at Cornell University. His understanding of how students learn informs much of this book’s approach.


Dave and his wife relax by biking or hiking, spending much of their free time in Canada, the Rockies, or the Blue Ridge Mountains. They have a son, a daughter, and four grandchildren.

Table of Contents

Preface

Part I: Exploring and Understanding Data

1. Stats Starts Here

1.1 What Is Statistics?

1.2 Data

1.3 Variables

2. Displaying and Describing Categorical Data

2.1 Summarizing and Displaying a Single Categorical variable

2.2 Exploring the Relationship Between Two Categorical variables

3. Displaying and Summarizing Quantitative Data  

3.1 Displaying quantitative variables  

3.2 Shape  

3.3 Center

3.4 Spread

3.5 Boxplots and 5-Number Summaries

3.6 The Center of Symmetric Distributions: The Mean

3.7 The Spread of Symmetric Distributions: The Standard Deviation

3.8 Summary—What to Tell About a quantitative variable

4. Understanding and Comparing Distributions

4.1 Comparing Groups with Histograms

4.2 Comparing Groups with Boxplots

4.3 Outliers

4.4 Timeplots: Order, Please!

4.5 Re-Expressing Data: A First Look

5. The Standard Deviation as a Ruler and the Normal Model

5.1 Standardizing with z-Scores

5.2 Shifting and Scaling

5.3 Normal Models

5.4 Finding Normal Percentiles

5.5 Normal Probability Plots

Part II: Exploring Relationships Between Variables

6. Scatterplots, Association, and Correlation  

6.1 Scatterplots

6.2 Correlation

6.3 Warning: Correlation ≠ Causation

6.4 Straightening Scatterplots

7. Linear Regression

7.1 Least Squares: The Line of “Best Fit”

7.2 The Linear Model

7.3 Finding the Least Squares Line

7.4 Regression to the Mean

7.5 Examining the Residuals

7.6 R2—The variation Accounted For by the Model

7.7 Regression Assumptions and Conditions

8. Regression Wisdom

8.1 Examining Residuals

8.2 Extrapolation: Reaching Beyond the Data

8.3 Outliers, Leverage, and Influence

8.4 Lurking variables and Causation

8.5 Working with Summary values

9. Re-expressing Data: Get It Straight!

9.1 Straightening Scatterplots – The Four Goals

9.2 Finding a Good Re-Expression

Part III: Gathering Data

10. Understanding Randomness

10.1 What Is Randomness?

10.2 Simulating by Hand

11. Sample Surveys

11.1 The Three Big Ideas of Sampling

11.2 Populations and Parameters

11.3 Simple Random Samples

11.4 Other Sampling Designs

11.5 From the Population to the Sample: You Can’t Always Get What You Want

11.6 The valid Survey

11.7 Common Sampling Mistakes, or How to Sample Badly

12. Experiments and Observational Studies

12.1 Observational Studies

12.2 Randomized, Comparative Experiments

12.3 The Four Principles of Experimental Design

12.4 Control Treatments

12.5 Blocking

12.6 Confounding

Part IV: Randomness and Probability

13. From Randomness to Probability

13.1 Random Phenomena

13.2 Modeling Probability

13.3 Formal Probability

14. Probability Rules!

14.1 The General Addition Rule

14.2 Conditional Probability and the General Multiplication Rule

14.3 Independence

14.4 Picturing Probability: Tables, Venn Diagrams, and Trees

14.5 Reversing the Conditioning and Bayes’ Rule

15. Random Variables

15.1 Center: The Expected value

15.2 Spread: The Standard Deviation

15.3 Shifting and Combining Random variables

15.4 Continuous Random variables

16. Probability Models

16.1 Bernoulli Trials

16.2 The Geometric Model

16.3 The Binomial Model

16.4 Approximating the Binomial with a Normal Model

16.5 The Continuity Correction

16.6 The Poisson Model

16.7 Other Continuous Random Variables: The Uniform and the Exponential

Part V: From the Data at Hand to the World at Large

17. Sampling Distribution Models

17.1 Sampling Distribution of a Proportion

17.2 When Does the Normal Model Work? Assumptions and Conditions

17.3 The Sampling Distribution of Other Statistics

17.4 The Central Limit Theorem: The Fundamental Theorem of Statistics  

17.5 Sampling Distributions: A Summary

18. Confidence Intervals for Proportions

18.1 A Confidence Interval

18.2 Interpreting Confidence Intervals: What Does 95% Confidence Really Mean?

18.3 Margin of Error: Certainty vs. Precision  

18.4 Assumptions and Conditions

19. Testing Hypotheses About Proportions

19.1 Hypotheses

19.2 P-values

19.3 The Reasoning of Hypothesis Testing

19.4 Alternative Alternatives

19.5 P-values and Decisions: What to Tell About a Hypothesis Test

20. Inferences About Means

20.1 Getting Started: The Central Limit Theorem (Again)

20.2 Gosset’s t

20.3 Interpreting Confidence Intervals

20.4 A Hypothesis Test for the Mean

20.5 Choosing the Sample Size

21. More About Tests and Intervals

21.1 Choosing Hypotheses  

21.2 How to Think About P-values

21.3 Alpha Levels  

21.4 Critical values for Hypothesis Tests

21.5 Errors

Part VI: Accessing Associations Between Variables

22. Comparing Groups

22.1 The Standard Deviation of a Difference

22.2 Assumptions and Conditions for Comparing Proportions

22.3 A Confidence Interval for the Difference Between Two Proportions

22.4 The Two Sample z-Test: Testing for the Difference Between Proportions

22.5 A Confidence Interval for the Difference Between Two Means  

22.6 The Two-Sample t-Test: Testing for the Difference Between Two Means

22.7 The Pooled t-Test: Everyone into the Pool?

23. Paired Samples and Blocks

23.1 Paired Data

23.2 Assumptions and Conditions

23.3 Confidence Intervals for Matched Pairs

23.4 Blocking

24. Comparing Counts

24.1 Goodness-of-Fit Tests

24.2 Chi-Square Test of Homogeneity

24.3 Examining the Residuals

24.4 Chi-Square Test of Independence

25. Inferences for Regression

25.1 The Population and the Sample

25.2 Assumptions and Conditions

25.3 Intuition About Regression Inference

25.4 Regression Inference

25.5 Standard Errors for Predicted values

25.6 Confidence Intervals for Predicted values

25.7 Logistic Regression

Part VII: Inference When Variables Are Related

26. Analysis of Variance

26.1 Testing Whether the Means of Several Groups Are Equal  

26.2 The ANOVA Table

26.3 Assumptions and Conditions

26.4 Comparing Means

26.5 ANOVA on Observational Data

27. Multifactor Analysis of Variance

27.1 A Two Factor ANOVA Model  

27.2 Assumptions and Conditions

27.3 Interactions

28. Multiple Regression

28.1 What Is Multiple Regression?

28.2 Interpreting Multiple Regression Coefficients

28.3 The Multiple Regression Model—Assumptions and Conditions

28.4 Multiple Regression Inference

28.5 Comparing Multiple Regression Models

29. Multiple Regression Wisdom

29.1 Indicators

29.2 Diagnosing Regression Models: Looking at the Cases

29.3 Building Multiple Regression Models

29.4 Building Multiple Regression Models Sequentially

Appendixes

A: Answers

B: Photo Acknowledgments

C: Index

D: Tables and Selected Formulas

Supplemental Materials

What is included with this book?

The New copy of this book will include any supplemental materials advertised. Please check the title of the book to determine if it should include any access cards, study guides, lab manuals, CDs, etc.

The Used, Rental and eBook copies of this book are not guaranteed to include any supplemental materials. Typically, only the book itself is included. This is true even if the title states it includes any access cards, study guides, lab manuals, CDs, etc.

Rewards Program