did-you-know? rent-now

Amazon no longer offers textbook rentals. We do!

did-you-know? rent-now

Amazon no longer offers textbook rentals. We do!

We're the #1 textbook rental company. Let us show you why.

9780137956180

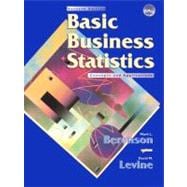
Basic Business Statistics: Concepts and Applications

by ;
  • ISBN13:

    9780137956180

  • ISBN10:

    0137956185

  • Edition: 7th
  • Format: Hardcover
  • Copyright: 1999-04-01
  • Publisher: Pearson College Div
  • View Upgraded Edition
  • Purchase Benefits
  • Free Shipping Icon Free Shipping On Orders Over $35!
    Your order must be $35 or more to qualify for free economy shipping. Bulk sales, PO's, Marketplace items, eBooks and apparel do not qualify for this offer.
  • eCampus.com Logo Get Rewarded for Ordering Your Textbooks! Enroll Now
List Price: $115.00

Summary

For a one- or two-term course in Business Statistics at the undergraduate or graduate level. This comprehensive 19-chapter business statistics text provides sufficient breadth of coverage and an applied approach which focuses on concepts and applications of statistics to the functional areas of businessaccounting, marketing, management, and economics and finance. Thoroughly revised to shift its emphasis more on concepts than statistical methods, it shows students how to properly use statistics to analyze data, demonstrates how computer software is an integral part of this analysis, and provides myriad cases and projects support the learning process.

Table of Contents

1. Introduction.
Why a Manager Needs to Know About Statistics. The Growth and Development of Modern Statistics. Statistical Thinking and Modern Management. Descriptive versus Inferential Statistics.

Appendices.
Basics of the Windows User Interface. Introduction to Microsoft Excel. Introduction to Minitab.

2. Data Collection.
Introduction. Why Do We Need Data? Sources of Data. Types of Data. Design of Survey Research. Types of Sampling Methods. Evaluating Survey Worthiness. Summary.

Appendices.
Using Microsoft Excel to Select a Random Sample. Using Minitab to Select a Random Sample.

3. Presenting Data in Tables and Charts.
Introduction. Organizing Numerical Data. Tables and Charts for Numerical Data. Graphing Bivariate Numerical Data. Tables and Charts for Categorical Data. Tabulating and Graphing Bivariate Categorical Data. Graphical Excellence. Summary. The Springville Herald Case.

Appendices.
Using Microsoft Excel for Tables and Charts. Using Minitab for Tables and Charts.

4. Summarizing and Describing Numerical Data.
Introduction. Exploring Numerical Data and Their Properties. Measures of Central Tendency, Variation, and Shape. Exploratory Data Analysis. Obtaining Descriptive Summary Measures from a Population. Obtaining Descriptive Summary Measures from a Population. Recognizing and Practicing Proper Descriptive Summarization and Exploring Ethical Issues. Summary. The Springville Herald Case.

Appendices.
Using Microsoft Excel for Descriptive Statistics. Using Minitab for Descriptive Statistics.

5. Basic Probability.
Introduction. Basic Probability Concepts. Conditional Probability. Bayes' Theorem. Ethical Issues and Probability. Summary.

6. Some Important Discrete Probability Distributions.
Introduction. The Probability Distribution for a Discrete Random Variable. Binomial Distribution. Poisson Distribution. Hypergeometric Distribution (Optional Topic). Covariance and Its Application in Finance (Optional Topic). Summary. The Springville Herald Case.

Appendices.
Using Microsoft Excel with Discrete Probability Distributions. Using Minitab with Discrete Probability Distributions.

7. Decision Making.
Introduction. The Payoff Table and Decision Trees. Criteria for Decision Making. Decision Making with Sample Information. Utility. Summary.

8. The Normal Distribution and Other Continuous Distributions.
Introduction. The Normal Distribution. Assessing the Normality. Assumption. The Exponential Distribution (Optional Topic). Summary. The Springville Herald Case.

Appendices.
Using Microsoft Excel with Continuous Probability Distributions. Using Minitab with Continuous Probability Distributions.

9. Sampling Distributions.
Introduction. Sampling Distribution of the Mean. Sampling Distribution of the Proportion. Sampling from Finite Populations. Summary. The Springville Herald Case.

Appendices.
Using Microsoft Excel with Sampling Distributions. Using Minitab with Sampling Distributions.

10. Confidence Interval Estimation.
Confidence Interval Estimation for the Mean (…s Known). Confidence Interval Estimation for the Mean (…s Unknown). Confidence Interval Estimation for the Proportion. Determining Sample Size. Estimation and Sample Size Determination for Finite Populations. Applications of Confidence Interval Estimation in Auditing. Confidence Interval Estimation and Ethical Issues. Summary. The Springville Herald Case.

Appendices.
Using Microsoft Excel for Confidence Interval Estimation. Using Minitab for Confidence Interval Estimation.

11. Fundamentals of Hypothesis Testing: One-Sample Tests.
Introduction. Hypothesis-Testing Methodology. …Z Test of Hypothesis for the Mean (…s Known). The p Value Approach to Hypothesis Testing. A Connection between Confidence Interval Estimation and Hypothesis Testing. One-Tailed Tests. t Test of Hypothesis for the Mean (…s Unknown). …s Test of Hypothesis for the Proportion. …c2 Test of Hypothesis for the Variance or Standard Deviation (Optional Topic). The Power of a Test (Optional Topic). Potential Hypothesis-Testing Pitfalls and Ethical Issues. Summary.

Appendices.
Using Microsoft Excel for One-Sample Tests of Hypothesis. Using Minitab for One-Sample Tests of Hypothesis.

12. Two-Sample Tests with Numerical Data.
Introduction. Comparing Two Independent Samples: t Test for the Mean Differences in Two Means. F Test for Differences in Two Variances. Comparing Two Related Samples: t Test for the Mean Difference. Wilcoxon Rank Sum for Differences in Two Medians. (Optional Topic). Wilcoxon Signed-Ranks Test for the Median Difference. (Optional Topic). Summary. The Springville Herald Case.

Appendices.
Using Microsoft Excel for Two-Sample Tests of Hypothesis for Numerical Data. Using Minitab for Two-Sample Tests of Hypothesis for Numerical Data.

13. ANOVA and Other c-Sample Tests with Numerical Data.
Introduction. The Completely Randomized Model: One-Factor Analysis of Variance. The Randomized Block Model. The Factorial Design Model: Two-Way Analysis of Variance. Kruskal-Wallis Rank Test for Differences in c Medians (Optional Topic). Friedman Rank Test for Differences in c Medians (Optional Topic). Summary. The Springville Herald Case.

Appendices.
Using Microsoft Excel for ANOVA and Other c-Sample Tests with Numerical Data. Using Minitab for ANOVA and Other c-Sample Tests with Numerical Data.

14. Two-Sample and c-Sample Tests with Categorical Data.
Introduction. Z Test for Differences in Two Proportions (Independent Samples). …c2 Test for Differences in Two Proportions (Independent Samples). …c2 Test for Differences in c Proportions (Independent Samples). …c2 Test of Independence. Summary. The Springville Herald Case.

Appendices.
Using Microsoft Excel for …c2 Contingency Table Tests. Using Minitab for …c2 Contingency Table Tests.

15. Statistical Applications in Quality and Productivity Management.
Introduction. Quality and Productivity: A Historical Perspective. Deming's 14 Points: A Theory of Management by Process. The Theory of Control Charts. Control Chart for the Proportion of Nonconforming Items—The p Chart. The Red Bead Experiment: Understanding Process Variability. The c Chart. Control Charts for the Range (R) and the Mean (X). Summary. The Springville Herald Case.

Appendices.
Using Microsoft Excel for Control Charts. Using Minitab for Control Charts.

16. Simple Linear Regression and Correlation.
Introduction. Types of Regression Models. Determining the Simple Linear Regression Equation. Measures of Variation. Assumptions. Residual Analysis. Measuring Autocorrelation: The Durbin-Watson Statistic. Inferences About the Slope. Estimation of Predicted Values. Pitfalls in Regression and Ethical Issues. Computations in Simple Linear Regression. Correlation—Measuring the Strength of the Association. Summary. The Springville Herald Case.

Appendices.
Using Microsoft Excel for Simple Linear Regression. Using Minitab for Simple Linear Regression.

17. Introduction to Multiple Regression.
Introduction. Developing the Multiple Regression Model. Residual Analysis for the Multiple Regression Model. Influence Analysis. Testing for the Significance of the Multiple Regression Model. Inferences Concerning the Population Regression Coefficients. Testing Portions of the Multiple Regression Model. Summary.

Appendices.
Using Microsoft Excel for Multiple Regression. Using Minitab for Multiple Regression.

18. Multiple Regression Model Building.
Introduction. The Curvilinear Regression Model. Dummy-Variable Models. Using Transformations in Regression Models. Collinearity. Model Building. Introduction to Logistic Regression (Optional Topic). Regression Modeling. Pitfalls in Multiple Regression and Ethical Issues. Modeling: Summary.

Appendices.
Using Microsoft Excel for Model Building. Using Minitab for Model Building.

19. Time-Series Analysis.
Introduction. The Importance of Business Forecasting. Component Factors of the Classical Multiplicative Time-Series Model. Smoothing the Annual Time-Series. Least-Squares Trend Fitting and Forecasting. The Holt-Winters Method for Trend Fitting and Forecasting. Autoregressive Modeling for Trend Fitting and Forecasting. Choosing an Appropriate Forecasting Model. Time-Series Forecasting of Monthly or Quarterly Data. Pitfalls Concerning Time-Series Analysis. Summary. The Springville Herald Case.

Appendices.
Using Microsoft Excel for Time-Series Analysis. Using Minitab for Time-Series Analysis.

Answers to Selected Problems.
Appendices.
Review of Arithmetic and Algebra. Summation Notation. Statistical Symbols and Greek Alphabet. Special Data Sets (for Team Projects). Tables. Documentation for CD-ROM Files.

Index.

Supplemental Materials

What is included with this book?

The New copy of this book will include any supplemental materials advertised. Please check the title of the book to determine if it should include any access cards, study guides, lab manuals, CDs, etc.

The Used, Rental and eBook copies of this book are not guaranteed to include any supplemental materials. Typically, only the book itself is included. This is true even if the title states it includes any access cards, study guides, lab manuals, CDs, etc.

Rewards Program