did-you-know? rent-now

Amazon no longer offers textbook rentals. We do!

did-you-know? rent-now

Amazon no longer offers textbook rentals. We do!

We're the #1 textbook rental company. Let us show you why.

9781250002761

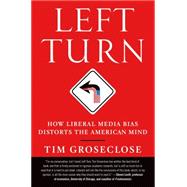
Left Turn How Liberal Media Bias Distorts the American Mind

by
  • ISBN13:

    9781250002761

  • ISBN10:

    1250002761

  • Format: Paperback
  • Copyright: 2012-02-28
  • Publisher: St. Martin's Griffin

Note: Supplemental materials are not guaranteed with Rental or Used book purchases.

Purchase Benefits

  • Free Shipping Icon Free Shipping On Orders Over $35!
    Your order must be $35 or more to qualify for free economy shipping. Bulk sales, PO's, Marketplace items, eBooks and apparel do not qualify for this offer.
  • eCampus.com Logo Get Rewarded for Ordering Your Textbooks! Enroll Now
List Price: $19.99 Save up to $7.00
  • Rent Book $12.99
    Add to Cart Free Shipping Icon Free Shipping

    TERM
    PRICE
    DUE
    USUALLY SHIPS IN 24-48 HOURS
    *This item is part of an exclusive publisher rental program and requires an additional convenience fee. This fee will be reflected in the shopping cart.

Supplemental Materials

What is included with this book?

Summary

Dr. Tim Groseclose, a professor of political science and economics at UCLA, has spent years constructing precise, quantitative measures of the political content of news, as a way to measure the PQ, or "political quotient" of voters and politicians. Among his conclusions are: (1) all mainstream media outlets have a liberal bias; and (2) while some supposedly conservative outlets-such the Washington Times or Fox News' Special Report-do lean right, their conservative bias is less pronounced than the liberal bias of most mainstream outlets. This timely, much-needed study is a provocative addition to the political debates of election year 2012.

Author Biography

TIM GROSECLOSE is the Marvin Hoffenberg Professor of American Politics at UCLA. He has joint appointments in the political science and economics departments. He has held previous faculty appointments at Caltech, Stanford University, Ohio State University, Harvard University, and Carnegie Mellon University

Table of Contents

  1.   What Are PQs and How Do They Reveal Media Bias?
 
“COME ON. POLITICAL science isn’t really a science,” said my friend Dawson Engler one day, trying to goad me.
Engler, one of the country’s premier computer scientists, is currently a professor at Stanford, where his specialty is operating systems. He has constructed his own operating system … twice.
He is the type of person who succeeds at nearly anything he tries. Born in Yuma, Arizona, during high school he placed second in the “Teenage Mr. Arizona” bodybuilding contest. After graduating from Arizona State University, he enrolled in the highly prestigious computer-science PhD program at MIT. It is unusual for a PhD student to publish a paper in a peer-reviewed scientific journal. Yet Engler published eight while a doctoral student. Shortly after Stanford hired him, for a brief period he dated one of the actresses from Baywatch.
When Engler goaded me, both of us held positions at MIT, and he knew that my position was in the political-science department. At MIT, which is filled with “real” scientists and engineers, you often hear quips like Engler’s. So when he made it, I was prepared.
“Look,” I said. “We can both agree that if you can graph something, then you can describe it mathematically.”
“Yeah,” said Engler.
“And people, all the time, talk about politicians being left wing or right wing.”
“Okay,” said Engler.
“And so if a position is left wing or right wing, then you can graph it.… Which means you can describe it mathematically.… Which means it’s science.”
Engler smiled. I don’t think I really convinced him, but he didn’t goad me any further. At least in my mind, I’d won the day’s debate.
*   *   *
WITHIN POLITICAL SCIENCE a small industry exists to do the “science” that I described to Engler: to calculate precise, numerical measurements that describe the liberalness or conservativeness of politicians. In fact, at the time Engler made his quip, I was working on such a project. Indeed, the political quotients that I describe in this book are based on that research.
A person’s PQ is a number, generally between 0 and 100, that describes how liberal he or she is. I have created a Web site, www.timgroseclose.com/calculate-your-pq, which allows you to compute your own PQ. I have computed PQs for members of Congress by observing their record on roll call votes.
By answering the following ten questions,1 you can get a rough approximation of your PQ. When you answer the questions, try to put yourself in the shoes of the members of Congress and decide how you would have voted at the time that the politicians considered the measure. For instance, some people feel that the “Cash for Clunkers” program was not as successful as they hoped or thought it would be. Accordingly, when you answer the question related to this program—as well as when you answer the other questions—think about your opinion of the issue when it was considered in Congress, not necessarily about how you feel about it now.
 1.    On January 29, 2009, the Senate passed the SCHIP bill (State Children’s Health Insurance Program). The bill would provide matching funds to states for health insurance to families with children. The funds would be limited to families with incomes less than three times the federal poverty level. The cost would be offset by increasing the federal tax on cigarettes from $0.61 to $1.00 a pack. Democrats voted 58–0 in favor of the bill; Republicans voted 8–32 against the bill.2
a. I would have favored the bill.
b. I can’t decide.
c. I would have opposed the bill.
 2.    On February 26, 2009, the Senate passed the District of Columbia House Voting Rights Act. The act would create a House district for D.C., and simultaneously create an additional House district in Utah. The Utah district would be subject to change or elimination by future censuses. The act would give D.C. one vote in the Electoral College, however it would not give D.C. representation in the Senate. Democrats favored the bill 56–2; Republicans opposed it 5–35.
a. I would have favored the bill.
b. I can’t decide.
c. I would have opposed the bill.
 3.    On April 1, 2009, the House passed a bill that would limit the bonuses of executives if their company received TARP (Troubled Asset Relief Program) funds. It granted authority to the secretary of the treasury to set standards for such executive compensation, including determining what is “excessive compensation.” Democrats favored the bill 236–8; Republicans opposed it 11–163.
a. I would have favored the bill.
b. I can’t decide.
c. I would have opposed the bill.
 4.    On April 30, 2009, Senator Richard Durbin proposed an amendment to the Helping Families Save Their Homes Act. His amendment, titled “Prevention of Mortgage Foreclosures,” was sometimes called the “cramdown” provision. According to the provision, if a homeowner’s income was low enough (less than 80 percent of the median income), then a bankruptcy judge could reduce the level of the interest and principle that the home owner owed on a mortgage. Democrats favored the amendment 45–12; Republicans opposed it 0–39.
a. I would have favored the amendment.
b. I can’t decide.
c. I would have opposed the amendment.
 5.    On June 18, 2009, the House considered a major appropriations bill. Jerry Lewis, a Republican from California, introduced an amendment to the bill that would bar funds from being used to shut down the Guantánamo Bay prison. The amendment would have acted against an executive order that President Obama had issued to close the facility. Democrats opposed the amendment 39–213; Republicans favored the amendment 173–3.
a. I would have opposed the amendment (that is, I would have favored shutting down Guantánamo).
b. I can’t decide.
c. I would have favored the amendment.
 6.    On June 26, 2009, the House passed the American Clean Energy and Security Act, the main provision of which was to create a “cap and trade system.” Under the system, energy producers would be allotted a cap on the pollutants they could emit, but they could buy credits from other energy producers if they wanted to emit more pollutants. Or, if they emitted less pollutants than their cap, they could sell some of their credits to other producers. The bill set a target of reducing emissions to 83 percent of the 2005 level by the year 2050. The act also included several billions of dollars for incentives for businesses to invest in green technologies. Democrats favored the bill 210–43; Republicans opposed it 8–169.
a. I would have favored the bill.
b. I can’t decide.
c. I would have opposed the bill.
 7.    On July 31, 2009, the House passed the “Cash for Clunkers” bill (officially named “The Consumer Assistance to Recycle and Save Program). It provided $2 billion in vouchers to people who traded in an older, less fuel-efficient car and bought a newer, more fuel-efficient car. Democrats favored the bill 238–14; Republicans opposed it 78–95.
a. I would have favored the bill.
b. I can’t decide.
c. I would have opposed the bill.
 8.    On August 26, 2009, the Senate voted on the confirmation of Sonia Sotomayor to be a justice on the Supreme Court. Democrats favored her confirmation 58–0; Republicans opposed it 9–31.
a. I would have favored her confirmation.
b. I can’t decide.
c. I would have opposed her confirmation.
 9.    On November 8, 2009, the Senate considered an amendment proposed by Senator Ben Nelson (D-Neb.) to the “Obamacare” health bill. His amendment would have barred federal money to be used to pay for an abortion. Further, federal money could not help pay for any health plan that covered abortions. The Democrats opposed the amendment 7–52; Republicans favored it 38–2. (Technically, the vote was on a motion by Barbara Boxer to table the Nelson amendment.)
a. I would have opposed the amendment.
b. I can’t decide.
c. I would have favored the amendment.
10.  On December 15, 2009, the Senate voted on a provision to allow U.S. citizens to import prescription drugs. Most important, it would have allowed citizens to order prescription drugs from Canadian pharmacies, which often sold the drugs at lower prices than U.S. pharmacies did. (The provision was the Dorgan amendment to the Reid amendment to the Pharmaceutical Market Access and Drug Safety Act.) Democrats opposed the measure 28–31; Republicans favored it 23–17.
a. I would have favored the provision.
b. I can’t decide.
c. I would have opposed the provision.
Give yourself ten points for each time that you answered “a,” five points for each “b,” and zero points for each “c.” Next, add up the points. That is approximately your PQ.
One feature of the PQ is that it is constructed from roll call votes in Congress. This means that simply by noting how members of Congress voted on those roll calls, I can calculate their PQs, and you can compare your PQ to theirs. The following are the PQs of some well-known politicians.
PQs and Media Bias
Perhaps the main contribution of the book is that it uses PQs to judge media bias. To do this, I conduct the following thought experiment. Suppose you were given a set of stories that a media outlet reported. But suppose, instead of knowing that they were news stories, you were told that they were speeches by a politician. After reading the would-be speeches, what would you guess to be the PQ of the would-be politician?
I define the slant quotient, or SQ, of an outlet as the solution to that thought experiment. In the article that Milyo and I wrote for the Quarterly Journal of Economics, we developed a statistical technique that calculates a precise, numerical SQ for the twenty news outlets that we examined. We found, for instance, that The New York Times has an SQ of 74, which is approximately the PQ of Sen. Joseph Lieberman.
The primary data that we used were citations to think tanks. This means that The New York Times’s citation patterns to left-wing, centrist, and right-wing think tanks were very similar to the patterns that Joe Lieberman adopted when he made speeches on the Senate floor.
The following figure illustrates the main results of that article. For now, the details behind the figure are unimportant. (But I will explain them in a later chapter). What is important is that, as the figure shows, we can describe numerically (i) the political views of politicians and (ii) the slants of various media outlets. Further, we can map these two sets of numbers to the same scale.
Despite what my hard-science friends might say, it is possible to analyze politics, including media bias, objectively, numerically, and, yes, scientifically.


Copyright © 2011 by Tim Groseclose

Supplemental Materials

What is included with this book?

The New copy of this book will include any supplemental materials advertised. Please check the title of the book to determine if it should include any access cards, study guides, lab manuals, CDs, etc.

The Used, Rental and eBook copies of this book are not guaranteed to include any supplemental materials. Typically, only the book itself is included. This is true even if the title states it includes any access cards, study guides, lab manuals, CDs, etc.

Excerpts

  1.   What Are PQs and How Do They Reveal Media Bias?
 
“COME ON. POLITICALscience isn’treallya science,” said my friend Dawson Engler one day, trying to goad me.
Engler, one of the country’s premier computer scientists, is currently a professor at Stanford, where his specialty is operating systems. He has constructed his own operating system … twice.
He is the type of person who succeeds at nearly anything he tries. Born in Yuma, Arizona, during high school he placed second in the “Teenage Mr. Arizona” bodybuilding contest. After graduating from Arizona State University, he enrolled in the highly prestigious computer-science PhD program at MIT. It is unusual for a PhD student to publish a paper in a peer-reviewed scientific journal. Yet Engler publishedeightwhile a doctoral student. Shortly after Stanford hired him, for a brief period he dated one of the actresses fromBaywatch.
When Engler goaded me, both of us held positions at MIT, and he knew that my position was in the political-science department. At MIT, which is filled with “real” scientists and engineers, you often hear quips like Engler’s. So when he made it, I was prepared.
“Look,” I said. “We can both agree that if you can graph something, then you can describe it mathematically.”
“Yeah,” said Engler.
“And people, all the time, talk about politicians being left wing or right wing.”
“Okay,” said Engler.
“And so if a position is left wing or right wing, then you can graph it.… Which means you can describe it mathematically.… Which means it’s science.”
Engler smiled. I don’t think I really convinced him, but he didn’t goad me any further. At least in my mind, I’d won the day’s debate.
*   *   *
WITHIN POLITICAL SCIENCEa small industry exists to do the “science” that I described to Engler: to calculate precise, numerical measurements that describe the liberalness or conservativeness of politicians. In fact, at the time Engler made his quip, I was working on such a project. Indeed, the political quotients that I describe in this book are based on that research.
A person’s PQ is a number, generally between 0 and 100, that describes how liberal he or she is. I have created a Web site, www.timgroseclose.com/calculate-your-pq, which allows you to compute your own PQ. I have computed PQs for members of Congress by observing their record on roll call votes.
By answering the following ten questions,1 you can get a rough approximation of your PQ. When you answer the questions, try to put yourself in the shoes of the members of Congress and decide how you would have votedat the time that the politicians considered the measure.For instance, some people feel that the “Cash for Clunkers” program was not as successful as they hoped or thought it would be. Accordingly, when you answer the question related to this program—as well as when you answer the other questions—think about your opinion of the issuewhen it was considered in Congress,not necessarily about how you feel about it now.
 1.    On January 29, 2009, the Senate passed the SCHIP bill (State Children’s Health Insurance Program). The bill would provide matching funds to states for health insurance to families with children. The funds would be limited to families with incomes less than three times the federal poverty level. The cost would be offset by increasing the federal tax on cigarettes from $0.61 to $1.00 a pack. Democrats voted 58–0 in favor of the bill; Republicans voted 8–32 against the bill.2
a. I would have favored the bill.
b. I can’t decide.
c. I would have opposed the bill.
 2.    On February 26, 2009, the Senate passed the District of Columbia House Voting Rights Act. The act would create a House district for D.C., and simultaneously create an additional House district in Utah. The Utah district would be subject to change or elimination by future censuses. The act would give D.C. one vote in the Electoral College, however it would not give D.C. representation in the Senate. Democrats favored the bill 56–2; Republicans opposed it 5–35.
a. I would have favored the bill.
b. I can’t decide.
c. I would have opposed the bill.
 3.    On April 1, 2009, the House passed a bill that would limit the bonuses of executives if their company received TARP (Troubled Asset Relief Program) funds. It granted authority to the secretary of the treasury to set standards for such executive compensation, including determining what is “excessive compensation.” Democrats favored the bill 236–8; Republicans opposed it 11–163.
a. I would have favored the bill.
b. I can’t decide.
c. I would have opposed the bill.
 4.    On April 30, 2009, Senator Richard Durbin proposed an amendment to the Helping Families Save Their Homes Act. His amendment, titled “Prevention of Mortgage Foreclosures,” was sometimes called the “cramdown” provision. According to the provision, if a homeowner’s income was low enough (less than 80 percent of the median income), then a bankruptcy judge could reduce the level of the interest and principle that the home owner owed on a mortgage. Democrats favored the amendment 45–12; Republicans opposed it 0–39.
a. I would have favored the amendment.
b. I can’t decide.
c. I would have opposed the amendment.
 5.    On June 18, 2009, the House considered a major appropriations bill. Jerry Lewis, a Republican from California, introduced an amendment to the bill that would bar funds from being used to shut down the Guantánamo Bay prison. The amendment would have acted against an executive order that President Obama had issued to close the facility. Democrats opposed the amendment 39–213; Republicans favored the amendment 173–3.
a. I would haveopposed the amendment (that is, I would have favored shutting down Guantánamo).
b. I can’t decide.
c. I would havefavored the amendment.
 6.    On June 26, 2009, the House passed the American Clean Energy and Security Act, the main provision of which was to create a “cap and trade system.” Under the system, energy producers would be allotted a cap on the pollutants they could emit, but they could buy credits from other energy producers if they wanted to emit more pollutants. Or, if they emitted less pollutants than their cap, they could sell some of their credits to other producers. The bill set a target of reducing emissions to 83 percent of the 2005 level by the year 2050. The act also included several billions of dollars for incentives for businesses to invest in green technologies. Democrats favored the bill 210–43; Republicans opposed it 8–169.
a. I would have favored the bill.
b. I can’t decide.
c. I would have opposed the bill.
 7.    On July 31, 2009, the House passed the “Cash for Clunkers” bill (officially named “The Consumer Assistance to Recycle and Save Program). It provided $2 billion in vouchers to people who traded in an older, less fuel-efficient car and bought a newer, more fuel-efficient car. Democrats favored the bill 238–14; Republicans opposed it 78–95.
a. I would have favored the bill.
b. I can’t decide.
c. I would have opposed the bill.
 8.    On August 26, 2009, the Senate voted on the confirmation of Sonia Sotomayor to be a justice on the Supreme Court. Democrats favored her confirmation 58–0; Republicans opposed it 9–31.
a. I would have favored her confirmation.
b. I can’t decide.
c. I would have opposed her confirmation.
 9.    On November 8, 2009, the Senate considered an amendment proposed by Senator Ben Nelson (D-Neb.) to the “Obamacare” health bill. His amendment would have barred federal money to be used to pay for an abortion. Further, federal money could not help pay for any health plan that covered abortions. The Democrats opposed the amendment 7–52; Republicans favored it 38–2. (Technically, the vote was on a motion by Barbara Boxer to table the Nelson amendment.)
a. I would have opposed the amendment.
b. I can’t decide.
c. I would have favored the amendment.
10.  On December 15, 2009, the Senate voted on a provision to allow U.S. citizens to import prescription drugs. Most important, it would have allowed citizens to order prescription drugs from Canadian pharmacies, which often sold the drugs at lower prices than U.S. pharmacies did. (The provision was the Dorgan amendment to the Reid amendment to the Pharmaceutical Market Access and Drug Safety Act.) Democrats opposed the measure 28–31; Republicans favored it 23–17.
a. I would have favored the provision.
b. I can’t decide.
c. I would have opposed the provision.
Give yourself ten points for each time that you answered “a,” five points for each “b,” and zero points for each “c.” Next, add up the points. That is approximately your PQ.
One feature of the PQ is that it is constructed from roll call votes in Congress. This means that simply by noting how members of Congress voted on those roll calls, I can calculate their PQs, and you can compare your PQ to theirs. The following are the PQs of some well-known politicians.
PQs and Media Bias
Perhaps the main contribution of the book is that it uses PQs to judgemedia bias. To do this, I conduct the following thought experiment. Suppose you were given a set of stories that a media outlet reported. But suppose, instead of knowing that they were news stories, you were told that they were speeches by a politician. After reading the would-be speeches, what would you guess to be the PQ of the would-be politician?
I define the slant quotient, or SQ, of an outlet as the solution to that thought experiment. In the article that Milyo and I wrote for theQuarterly Journal of Economics,we developed a statistical technique that calculates a precise, numerical SQ for the twenty news outlets that we examined. We found, for instance, thatThe New York Timeshas an SQ of 74, which is approximately the PQ of Sen. Joseph Lieberman.
The primary data that we used were citations to think tanks. This means thatThe New York Times’s citation patterns to left-wing, centrist, and right-wing think tanks were very similar to the patterns that Joe Lieberman adopted when he made speeches on the Senate floor.
The following figure illustrates the main results of that article. For now, the details behind the figure are unimportant. (But I will explain them in a later chapter). Whatisimportant is that, as the figure shows, we can describe numerically (i) the political views of politicians and (ii) the slants of various media outlets. Further, we can map these two sets of numbers to the same scale.
Despite what my hard-science friends might say, itispossible to analyze politics, including media bias, objectively, numerically, and, yes, scientifically.


Copyright © 2011 by Tim Groseclose

Rewards Program