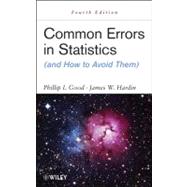
PHILLIP I. GOOD, PhD, is Operations Manager at Information Research, a consulting firm specializing in statistical solutions for private and public organizations. He has published more than thirty scholarly works and more than 600 popular articles. Dr. Good is the author of Introduction to Statistics Through Resampling Methods and R/S-PLUS®, Introduction to Statistics Through Resampling Methods and Microsoft Office Excel®, and Analyzing the Large Number of Variables in Biomedical and Satellite Imagery, all published by Wiley.
JAMES W. HARDIN, PhD, is Associate Professor and Biostatistics Division Director of the Department of Epidemiology and Biostatistics at the University of South Carolina. Dr. Hardin has published extensively in his areas of research interest, which include generalized linear models, generalized estimating equations, survival models, and computational statistics. He is also an affiliate faculty member of the Institute for Families in Society at the University of South Carolina.
Preface xi
PART I FOUNDATIONS 1
1. Sources of Error 3
Prescription 4
Fundamental Concepts 5
Surveys and Long-Term Studies 9
Ad-Hoc, Post-Hoc Hypotheses 9
To Learn More 13
2. Hypotheses: The Why of Your Research 15
Prescription 15
What Is a Hypothesis? 16
How Precise Must a Hypothesis Be? 17
Found Data 18
Null or Nil Hypothesis 19
Neyman–Pearson Theory 20
Deduction and Induction 25
Losses 26
Decisions 27
To Learn More 28
3. Collecting Data 31
Preparation 31
Response Variables 32
Determining Sample Size 37
Fundamental Assumptions 46
Experimental Design 47
Four Guidelines 49
Are Experiments Really Necessary? 53
To Learn More 54
PART II STATISTICAL ANALYSIS 57
4. Data Quality Assessment 59
Objectives 60
Review the Sampling Design 60
Data Review 62
To Learn More 63
5. Estimation 65
Prevention 65
Desirable and Not-So-Desirable Estimators 68
Interval Estimates 72
Improved Results 77
Summary 78
To Learn More 78
6. Testing Hypotheses: Choosing a Test Statistic 79
First Steps 80
Test Assumptions 82
Binomial Trials 84
Categorical Data 85
Time-To-Event Data (Survival Analysis) 86
Comparing the Means of Two Sets of Measurements 90
Do Not Let Your Software Do Your Thinking For You 99
Comparing Variances 100
Comparing the Means of K Samples 105
Higher-Order Experimental Designs 108
Inferior Tests 113
Multiple Tests 114
Before You Draw Conclusions 115
Induction 116
Summary 117
To Learn More 117
7. Strengths and Limitations of Some Miscellaneous Statistical Procedures 119
Nonrandom Samples 119
Modern Statistical Methods 120
Bootstrap 121
Bayesian Methodology 123
Meta-Analysis 131
Permutation Tests 135
To Learn More 137
8. Reporting Your Results 139
Fundamentals 139
Descriptive Statistics 144
Ordinal Data 149
Tables 149
Standard Error 151
p-Values 155
Confidence Intervals 156
Recognizing and Reporting Biases 158
Reporting Power 160
Drawing Conclusions 160
Publishing Statistical Theory 162
A Slippery Slope 162
Summary 163
To Learn More 163
9. Interpreting Reports 165
With a Grain of Salt 165
The Authors 166
Cost–Benefit Analysis 167
The Samples 167
Aggregating Data 168
Experimental Design 168
Descriptive Statistics 169
The Analysis 169
Correlation and Regression 171
Graphics 171
Conclusions 172
Rates and Percentages 174
Interpreting Computer Printouts 175
Summary 178
To Learn More 178
10. Graphics 181
Is a Graph Really Necessary? 182
KISS 182
The Soccer Data 182
Five Rules for Avoiding Bad Graphics 183
One Rule for Correct Usage of Three-Dimensional Graphics 194
The Misunderstood and Maligned Pie Chart 196
Two Rules for Effective Display of Subgroup Information 198
Two Rules for Text Elements in Graphics 201
Multidimensional Displays 203
Choosing Effective Display Elements 209
Oral Presentations 209
Summary 210
To Learn More 211
PART III BUILDING A MODEL 213
11. Univariate Regression 215
Model Selection 215
Stratification 222
Further Considerations 226
Summary 233
To Learn More 234
12. Alternate Methods of Regression 237
Linear Versus Nonlinear Regression 238
Least-Absolute-Deviation Regression 238
Quantile Regression 243
Survival Analysis 245
The Ecological Fallacy 246
Nonsense Regression 248
Reporting the Results 248
Summary 248
To Learn More 249
13. Multivariable Regression 251
Caveats 251
Dynamic Models 256
Factor Analysis 256
Reporting Your Results 258
A Conjecture 260
Decision Trees 261
Building a Successful Model 264
To Learn More 265
14. Modeling Counts and Correlated Data 267
Counts 268
Binomial Outcomes 268
Common Sources of Error 269
Panel Data 270
Fixed- and Random-Effects Models 270
Population-Averaged Generalized Estimating Equation Models (GEEs) 271
Subject-Specific or Population-Averaged? 272
Variance Estimation 272
Quick Reference for Popular Panel Estimators 273
To Learn More 275
15. Validation 277
Objectives 277
Methods of Validation 278
Measures of Predictive Success 283
To Learn More 285
Glossary 287
Bibliography 291
Author Index 319
Subject Index 329
The New copy of this book will include any supplemental materials advertised. Please check the title of the book to determine if it should include any access cards, study guides, lab manuals, CDs, etc.
The Used, Rental and eBook copies of this book are not guaranteed to include any supplemental materials. Typically, only the book itself is included. This is true even if the title states it includes any access cards, study guides, lab manuals, CDs, etc.