rent-now

Rent More, Save More! Use code: ECRENTAL

5% off 1 book, 7% off 2 books, 10% off 3+ books

9780415093996

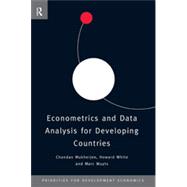
Econometrics and Data Analysis for Developing Countries

by ;
  • ISBN13:

    9780415093996

  • ISBN10:

    0415093996

  • Edition: Disk
  • Format: Hardcover
  • Copyright: 1998-01-16
  • Publisher: Routledge

Note: Supplemental materials are not guaranteed with Rental or Used book purchases.

Purchase Benefits

  • Free Shipping Icon Free Shipping On Orders Over $35!
    Your order must be $35 or more to qualify for free economy shipping. Bulk sales, PO's, Marketplace items, eBooks and apparel do not qualify for this offer.
  • eCampus.com Logo Get Rewarded for Ordering Your Textbooks! Enroll Now
List Price: $260.00 Save up to $203.90
  • Rent Book $185.25
    Add to Cart Free Shipping Icon Free Shipping

    TERM
    PRICE
    DUE
    USUALLY SHIPS IN 3-5 BUSINESS DAYS
    *This item is part of an exclusive publisher rental program and requires an additional convenience fee. This fee will be reflected in the shopping cart.

How To: Textbook Rental

Looking to rent a book? Rent Econometrics and Data Analysis for Developing Countries [ISBN: 9780415093996] for the semester, quarter, and short term or search our site for other textbooks by Mukherjee; Chandan. Renting a textbook can save you up to 90% from the cost of buying.

Summary

Getting accurate data on less developed countries has created great problems for studying these areas. Yet until recently students of development economics have relied on standard econometrics texts, which assume a Western context.Econometrics and Data Analysis forDeveloping Countriessolves this problem. It will be essential reading for all advanced students of development economics.

Table of Contents

List of figures
ix(4)
List of tables
xiii(3)
List of boxes
xvi(1)
Preface xvii
Introduction 1(20)
1 The purpose of this book 1(2)
2 The approach of this book: an example 3(18)
Part I Foundations of data analysis 21(88)
1 Model specification and applied research
23(21)
1.1 Introduction
23(1)
1.2 Model specification and statistical inference
24(5)
1.3 The role of data in model specification: traditional modelling
29(3)
1.4 The role of data in model specification: modern approaches
32(7)
1.5 The time dimension in data
39(3)
1.6 Summary of main points
42(2)
2 Modelling an average
44(31)
2.1 Introduction
44(1)
2.2 Kinds of averages
45(5)
2.3 The assumptions of the model
50(3)
2.4 The sample mean as best linear unbiased estimator (BLUE)
53(5)
2.5 Normality and the maximum likelihood principle
58(3)
2.6 Inference from a sample of a normal distribution
61(10)
2.7 Summary of main points
71(2)
Appendix 2.1: Properties of mean and variance
73(1)
Appendix 2.2: Standard sampling distributions
73(2)
3 Outliers, skewness and data transformations
75(34)
3.1 Introduction
75(1)
3.2 The least squares principle and the concept of resistance
76(4)
3.3 Mean-based versus order-based sample statistics
80(10)
3.4 Detecting non-normality in data
90(7)
3.5 Data transformations to eliminate skewness
97(9)
3.6 Summary of main points
106(3)
Part II Regression and data analysis 109(140)
4 Data analysis and simple regression
111(52)
4.1 Introduction
111(1)
4.2 Modelling simple regression
112(2)
4.3 Linear regression and the least squares principle
114(6)
4.4 Inference from classical normal linear regression model
120(4)
4.5 Regression with graphics: checking the model assumptions
124(12)
4.6 Regression through the origin
136(1)
4.7 Outliers, leverage and influence
137(11)
4.8 Transformation towards linearity
148(11)
4.9 Summary of main points
159(4)
5 Partial regression: interpreting multiple regression coefficients
163(45)
5.1 Introduction
163(2)
5.2 The price of food and the demand for manufactured goods in India
165(8)
5.3 Least squares and the sample multiple regression line
173(7)
5.4 Partial regression and partial correlation
180(4)
5.5 The linear regression model
184(8)
5.6 The t-test in multiple regression
192(6)
5.7 Fragility analysis: making sense of regression coefficients
198(8)
5.8 Summary of main points
206(2)
6 Model selection and misspecification in multiple regression
208(41)
6.1 Introduction
208(1)
6.2 Griffin's aid versus savings model: the omitted variable bias
209(3)
6.3 Omitted variable bias: the theory
212(7)
6.4 Testing zero restrictions
219(10)
6.5 Testing non-zero linear restrictions
229(2)
6.6 Tests of parameter stability
231(6)
6.7 The use of dummy variables
237(9)
6.8 Summary of main points
246(3)
Part III Analysing cross-section data 249(84)
7 Dealing with heteroscedasticity
251(28)
7.1 Introduction
251(1)
7.2 Diagnostic plots: looking for heteroscedasticity
252(4)
7.3 Testing for heteroscedasticity
256(8)
7.4 Transformations towards homoscedasticity
264(6)
7.5 Dealing with genuine heteroscedasticity: weighted least squares and heteroscedastic standard errors
270(7)
7.6 Summary of main points
277(2)
8 Categories, counts and measurements
279(23)
8.1 Introduction
279(1)
8.2 Regression on a categorical variable: using dummy variables
280(7)
8.3 Contingency tables: association between categorical variables
287(6)
8.4 Partial association and interaction
293(2)
8.5 Multiple regression on categorical variables
295(3)
8.6 Summary of main points
298(4)
9 Logit transformation, modelling and regression
302(31)
9.1 Introduction
302(1)
9.2 The logit transformation
303(4)
9.3 Logit modelling with contingency tables
307(6)
9.4 The linear probability model versus logit regression
313(7)
9.5 Estimation and hypothesis testing in logit regression
320(7)
9.6 Graphics and residual analysis in logit regression
327(4)
9.7 Summary of main points
331(2)
Part IV Regression with time-series data 333(80)
10 Trends, spurious regressions and transformations to stationarity
335(31)
10.1 Introduction
335(1)
10.2 Stationarity and non-stationarity
335(3)
10.3 Random walks and spurious regression
338(11)
10.4 Testing for stationarity
349(7)
10.5 Transformations to stationarity
356(7)
10.6 Summary of main points
363(2)
Appendix 10.1: Generated DSP and TSP series for exercises
365(1)
11 Misspecification and autocorrelation
366(27)
11.1 Introduction
366(1)
11.2 What is autocorrelation and why is it a problem?
366(4)
11.3 Why do we get autocorrelation?
370(9)
11.4 Detecting autocorrelation
379(8)
11.5 What to do about autocorrelation
387(3)
11.6 Summary of main points
390(1)
Appendix 11.1: Derivation of variance and covariance for AR(1) model
391(2)
12 Cointegration and the error correction model
393(20)
12.1 Introduction
393(1)
12.2 What is cointegration?
393(6)
12.3 Testing for cointegration
399(7)
12.4 The error correction model (ECM)
406(6)
12.5 Summary of main points
412(1)
Part V Simultaneous equation models 413(42)
13 Misspecification bias from single equation estimation
415(22)
13.1 Introduction
415(2)
13.2 Simultaneity bias in a supply and demand model
417(5)
13.3 Simultaneity bias: the theory
422(3)
13.4 The Granger and Sims tests for causality and concepts of exogeneity
425(3)
13.5 The identification problem
428(6)
13.6 Summary of main points
434(3)
14 Estimating simultaneous equation models
437(18)
14.1 Introduction
437(1)
14.2 Recursive models
437(2)
14.3 Indirect least squares
439(3)
14.4 Instrumental variable estimation and two-stage least squares
442(3)
14.5 Estimating the consumption function in a simultaneous system
445(3)
14.6 Full information estimation techniques
448(3)
14.7 Summary of main points
451(4)
Appendix A: The data sets used in this book 455(8)
Appendix B: Statistical tables 463(18)
References 481(4)
Index 485

Supplemental Materials

What is included with this book?

The New copy of this book will include any supplemental materials advertised. Please check the title of the book to determine if it should include any access cards, study guides, lab manuals, CDs, etc.

The Used, Rental and eBook copies of this book are not guaranteed to include any supplemental materials. Typically, only the book itself is included. This is true even if the title states it includes any access cards, study guides, lab manuals, CDs, etc.

Rewards Program