did-you-know? rent-now

Amazon no longer offers textbook rentals. We do!

did-you-know? rent-now

Amazon no longer offers textbook rentals. We do!

We're the #1 textbook rental company. Let us show you why.

9781118845844

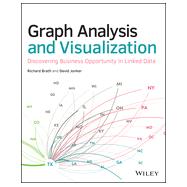
Graph Analysis and Visualization Discovering Business Opportunity in Linked Data

by ;
  • ISBN13:

    9781118845844

  • ISBN10:

    1118845846

  • Edition: 1st
  • Format: Paperback
  • Copyright: 2015-01-27
  • Publisher: Wiley
  • Purchase Benefits
List Price: $53.33 Save up to $8.33
  • Digital
    $45.00
    Add to Cart

    DURATION
    PRICE

Supplemental Materials

What is included with this book?

Summary

Wring more out of the data with a scientific approach to analysis

Graph Analysis and Visualization brings graph theory out of the lab and into the real world. Using sophisticated methods and tools that span analysis functions, this guide shows you how to exploit graph and network analytic techniques to enable the discovery of new business insights and opportunities. Published in full color, the book describes the process of creating powerful visualizations using a rich and engaging set of examples from sports, finance, marketing, security, social media, and more. You will find practical guidance toward pattern identification and using various data sources, including Big Data, plus clear instruction on the use of software and programming. The companion website offers data sets, full code examples in Python, and links to all the tools covered in the book.

Science has already reaped the benefit of network and graph theory, which has powered breakthroughs in physics, economics, genetics, and more. This book brings those proven techniques into the world of business, finance, strategy, and design, helping extract more information from data and better communicate the results to decision-makers.

  • Study graphical examples of networks using clear and insightful visualizations
  • Analyze specifically-curated, easy-to-use data sets from various industries
  • Learn the software tools and programming languages that extract insights from data
  • Code examples using the popular Python programming language

There is a tremendous body of scientific work on network and graph theory, but very little of it directly applies to analyst functions outside of the core sciences – until now. Written for those seeking empirically based, systematic analysis methods and powerful tools that apply outside the lab, Graph Analysis and Visualization is a thorough, authoritative resource.
Author Biography

Richard Brath is actively involved in the research, design, and development of data visualization and visual analytics for both research and commercial applications for some of the world’s largest companies and top software vendors. His solutions range from rich, interactive visualizations for mobile devices, to large multi-touch, multi-screen installations and web-based analytical visualizations for business applications. David Jonker is a designer and developer of visualization platforms and applications for web-based, distributed, desktop, and mobile use. He created visualization products for NASDAQ MarketSite real-time broadcast in Times Square, and is currently a lead on the DARPA XDATA program, developing new tools and technologies for making sense of Big Data. Brath and Jonker are partners at a leading visual analytics firm. Between them they have presented at more than 30 industry conferences, and have published numerous articles and research papers.

Table of Contents

Introduction xvii

PART 1 Overview

Chapter 1 Why Graphs? 3

Chapter 2 A Graph for Every Problem 27

PART 2 Process and Tools

Chapter 3 Data--Collect, Clean, and Connect 55

Chapter 4 Stats and Layout 87

Chapter 5 Visual Attributes 125

Chapter 6 Explore and Explain 157

Chapter 7 Point-and-Click Graph Tools 187

Chapter 8 Lightweight Programming 223

PART 3 Visual Analysis of Graphs

Chapter 9 Relationships 275

Chapter 10 Hierarchies 293

Chapter 11 Communities 315

Chapter 12 Flows 351

Chapter 13 Spatial Networks 389

PART 4 Advanced Techniques

Chapter 14 Big Data 419

Chapter 15 Dynamic Graphs 449

Chapter 16 Design 473

Glossary 497

Index 501

Supplemental Materials

What is included with this book?

The New copy of this book will include any supplemental materials advertised. Please check the title of the book to determine if it should include any access cards, study guides, lab manuals, CDs, etc.

The Used, Rental and eBook copies of this book are not guaranteed to include any supplemental materials. Typically, only the book itself is included. This is true even if the title states it includes any access cards, study guides, lab manuals, CDs, etc.

Rewards Program