did-you-know? rent-now

Amazon no longer offers textbook rentals. We do!

did-you-know? rent-now

Amazon no longer offers textbook rentals. We do!

We're the #1 textbook rental company. Let us show you why.

9781119616085

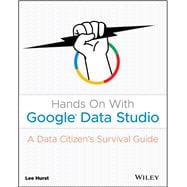
Hands On With Google Data Studio A Data Citizen's Survival Guide

by
  • ISBN13:

    9781119616085

  • ISBN10:

    1119616085

  • Edition: 1st
  • Format: Paperback
  • Copyright: 2020-02-05
  • Publisher: Wiley
  • Purchase Benefits
  • Free Shipping Icon Free Shipping On Orders Over $35!
    Your order must be $35 or more to qualify for free economy shipping. Bulk sales, PO's, Marketplace items, eBooks and apparel do not qualify for this offer.
  • eCampus.com Logo Get Rewarded for Ordering Your Textbooks! Enroll Now
List Price: $40.00 Save up to $13.00
  • Buy New
    $38.80
    Add to Cart Free Shipping Icon Free Shipping

    THIS IS A HARD-TO-FIND TITLE. WE ARE MAKING EVERY EFFORT TO OBTAIN THIS ITEM, BUT DO NOT GUARANTEE STOCK.

Supplemental Materials

What is included with this book?

Summary

Learn how to easily transform your data into engaging, interactive visual reports!

Data is no longer the sole domain of tech professionals and scientists. Whether in our personal, business, or community lives, data is rapidly increasing in both importance and sheer volume. The ability to visualize all kinds of data is now within reach for anyone with a computer and an internet connection. Google Data Studio, quickly becoming the most popular free tool in data visualization, offers users a flexible, powerful way to transform private and public data into interactive knowledge that can be easily shared and understood. Hands On With Google Data Studio teaches you how to visualize your data today and produce professional quality results quickly and easily. 

No previous experience is required to get started right away—all you need is this guide, a Gmail account, and a little curiosity to access and visualize data just like large businesses and organizations. Clear, step-by-step instructions help you identify business trends, turn budget data into a report, assess how your websites or business listings are performing, analyze public data, and much more. Practical examples and expert tips are found throughout the text to help you fully understand and apply your new knowledge to a wide array of real-world scenarios. This engaging, reader-friendly guide will enable you to:

  • Use Google Data Studio to access various types of data, from your own personal data to public sources
  • Build your first data set, navigate the Data Studio interface, customize reports, and share your work
  • Learn the fundamentals of data visualization, personal data accessibility, and open data API's
  • Harness the power of publicly accessible data services including Google’s recently released Data Set Search
  • Add banners, logos, custom graphics, and color palettes

Hands On With Google Data Studio: A Data Citizens Survival Guide is a must-have resource for anyone starting their data visualization journey, from individuals, consultants, and small business owners to large business and organization managers and leaders.
 

Author Biography

LEE HURST began doing application development in 1995 as a consultant, later joining IBM where he worked as a web application developer. Since 2006 he has worked for EnPro Industries building custom eCommerce solutions and consulting for global web development, analytics solutions, and SEO. He assists small businesses and agencies through his Helpfullee website, and maintains the Google Data Studio Resource Finder, a free service he created in 2017.

Table of Contents

Introduction xv

Part I Data Studio Basics 1

Chapter 1 Data Studio and the Data Citizen 3

Data, Data Everywhere 4

Accessibility of Data 4

Deriving Value from Data 5

The Role of Data Studio 7

A Brief History of Data Studio 9

Fundamentals First 12

Where to Go for Help 12

Time to Get Started! 13

Chapter 2 Cooking with Google Data Studio 15

Our First Example 15

Step 1. Select a Dish to Prepare: Visualizing a Bank Account 16

Before We Start: Things You’ll Need 19

Step 2. Let’s Go Shopping! Getting the Data 19

Step 3. Unpack the Groceries: Setting Up Google Drive 21

Step 4. Preparing the Ingredients: Working with Google Sheets 22

Step 5. Familiarizing Yourself with the Kitchen: Data Studio Home Screen and Starting a New Report 25

Step 6. Assemble the Ingredients: Connecting the Data to the Report 28

Step 7. Set the Table: Adding Your First Chart 35

Step 8. Keep Score with Scorecards 40

Step 9. It’s About Time: Building the Time-Series Chart 45

Step 10. Serving Suggestions: Finishing Touches and Sharing Your Report 50

Summary 55

Chapter 3 Enhancing Basic Graphs 57

Static Report Design 57

Before Getting Started: Things You’ll Need 59

Step 1. Copy the Report 60

Step 2. Modify the Header and Set the Date Range 61

Step 3. Modify Scorecards 63

Step 4. Modify Time-Series Chart 65

Step 5. Modify the Transactions Table 66

Step 6. Save the Report as PDF for Sharing 69

Summary 70

Chapter 4 Data Exploration with Interactive Elements 73

Building Our Workbench Example 73

Step 1. Selecting a Dish to Prepare: Exploration Workbench for a Bank Account 74

Step 2. Let’s Go Shopping! Getting the Data Set 77

Step 3. Assembling the Ingredients: Connecting Data to the Report 78

Adding Chart Components and Graphic Elements 82

Step 4. Reuse, Recycle, and Repurpose: Copying Elements from Other Reports 82

Step 5. Easy as Pie! Adding a Pie Chart 84

Step 6. Step Up to the Bar: Adding the Bar Chart 85

Step 7. Lining Things Up: Adding the Line Chart 90

Step 8. Tables, Again!? Setting Up the Table 91

Adding and Configuring Filter Controls 92

Step 9. Fun with Filters: Setting Up the Standard Filter Controls 92

Tips for Using Interactive Filters 94

Find the Answers: Filter Challenge 95

Summary 97

Part II Business and Marketing Applications 99

Chapter 5 Web Data Visualization with Google Analytics 101

Google Services for Websites and Business 102

A Brief Primer for Google Analytics 104

Using a Template to Create a New Report 106

Building the Google Analytics Report 110

Modifying the Charts 112

Working with the New Report 117

A Real-World Example: The Effects of a Beach Party in Spain on Web Traffic 117

The Limits of Demographic Data from Google Analytics 124

Now for a Side Dish: Adding a Page and Using Filters 126

Summary 132

Chapter 6 Using Google Search Console for Audience Insights 135

Search Console and Search Results Pages 136

Creating a Search Console Report with Data Studio 141

Step 1. Selecting the Dish to Prepare 142

Step 2. Let’s Go Shopping! 144

Step 3. Assemble the Ingredients 147

Step 4. Setting the Table 153

Bon Appetite! Using the Search Console Report 157

An Example for Your Soul! 161

Summary 170

Chapter 7 Viewing Local Organization Data from Google My Business 173

Google Search and the Local Organization 173

GMB: The New Home Page in the Search Results 175

What the User Sees in a GMB Listing 176

What the Owner Sees in a GMB Listing 180

Why Use Data Studio for GMB? 185

Step 1. Selecting the Dish to Prepare 187

The Actions Page 189

The Reviews Page 190

The Search Page 192

Before You Begin: What You Need to Get Started 194

Step 2. Let’s Go Shopping and Assemble the Ingredients 195

Step 3. Setting the Table 202

Report, Page, and Header Setup 203

Page Navigation Button Setup 206

Building the Actions Page 209

Building the Search Page 213

Building the Reviews Page 215

Summary 218

Part III Beyond the Office 221

Chapter 8 Getting Personal 223

Creating Your Own Data 223

Using Google Forms to Collect Your Own Data 225

Curating Data from Other Sources 248

Setting Up IFTTT to Capture Tweets 250

Preparing the Google Sheet for Data Studio 256

Create a Data Source for the Google Sheet 256

Create the New Twitter Report 258

Working with Data Generated for You 262

Music Service Tracking Example 262

Google Fit Community Connector Example 269

Community Connector Setup for Google Fit 270

Bringing It All Together 280

Created Data 280

Curated Data 283

Generated Data 284

Summary 288

Chapter 9 Going Public 291

Shared Data Sets 291

Searching for Data Sets 292

Getting Data from Kaggle 294

Using a Kaggle Account 294

Building the UFO Sightings Workbench 302

Dealing with Performance Issues in Reports 307

Using the Extract Data Connector to Speed Up Reports 307

data.world and Makeover Monday 314

Bringing It Home: Real Estate in Your Neighborhood 330

Selecting the Dish to Prepare 331

Going Shopping: Hunting for Housing Data 332

Unpacking the Groceries: Moving the File to Google Drive 337

Preparing the Ingredients: Fixing Data Formatting Issues 338

Assembling the Ingredients: Connecting the Data to the Report 340

Preparing the Meal: The Plan Meets Reality 340

Sharing Your Dish: Embedding Reports 346

Embedding a Report in a Google Site 351

Embedding a Report in a WordPress Site 353

Dealing with Pivoted Data 356

Summary 361

Chapter 10 Where Do You Go from Here? 363

Helping Your Audience See the Light 363

Annotation Ideas for Static Reports 364

Annotation Ideas for Interactive Reports 367

Providing Detailed Instructions for Users 371

Community Visualizations 375

Data Studio as an Application Development Platform 377

Exotic Ingredients and Your Pantry 383

Data Blending 383

File Upload 388

BigQuery for Big Data 390

Community Connectors 395

The Latest Dishes: New Developments and Releases 396

Summary 396

Index 399

Supplemental Materials

What is included with this book?

The New copy of this book will include any supplemental materials advertised. Please check the title of the book to determine if it should include any access cards, study guides, lab manuals, CDs, etc.

The Used, Rental and eBook copies of this book are not guaranteed to include any supplemental materials. Typically, only the book itself is included. This is true even if the title states it includes any access cards, study guides, lab manuals, CDs, etc.

Rewards Program