rent-now

Rent More, Save More! Use code: ECRENTAL

5% off 1 book, 7% off 2 books, 10% off 3+ books

9780534389314

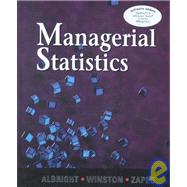
Managerial Statistics

by ; ;
  • ISBN13:

    9780534389314

  • ISBN10:

    0534389317

  • Edition: CD
  • Format: Hardcover
  • Copyright: 2001-05-15
  • Publisher: South-Western College Pub
  • View Upgraded Edition
  • Purchase Benefits
  • Free Shipping Icon Free Shipping On Orders Over $35!
    Your order must be $35 or more to qualify for free economy shipping. Bulk sales, PO's, Marketplace items, eBooks and apparel do not qualify for this offer.
  • eCampus.com Logo Get Rewarded for Ordering Your Textbooks! Enroll Now
List Price: $299.99

Summary

This text is designed for the undergraduate or MBA level course in Business and Economic Statistics. The course can be found in schools of business or departments of statistics and mathematics. College algebra is a prerequisite. MANAGERIAL STATISTICS presents core statistical methods in a modern, unified spreadsheet-oriented approach with a focus on applications to business. This text illustrates, in a very hands-on, example-based approach, a variety of statistical methods to help students analyze data sets and uncover important information to aid decision making. This application focus, together with Excel spreadsheet add-ins, provides a complete learning resource for students.

Author Biography

S. Christian Albright Chris Albright got his B.S. degree in Mathematics from Stanford in 1968 and his Ph.D. in Operations Research from Stanford in 1972. Since then he has been teaching in the Operations and Decision Technologies Department in the Kelley School of Business at Indiana University Wayne Winston Wayne L. Winston is Professor of Operations and Decision Technologies in the Kelley School of Business at Indiana University, where he has taught since 1975. Wayne received his B.S. degree in mathematics from MIT and his Ph.D. degree in operations research from Yale Christopher J. Zappe Chris earned his B.A. in mathematics from DePauw University in 1983 and his M.B.A. and Ph.D. in decision sciences from Indiana University in 1987 and 1988, respectively. Since 1993, Chris has been serving as an associate professor in the Department of Management at Bucknell University, where he teaches undergraduate courses in business statistics, decision analysis, and computer simulation. Currently, Chris is a visiting faculty member in the Operations and Decision Technologies Department of the Kelley School of Business at Indiana University in Bloomington

Table of Contents

Preface xv
Introduction to Managerial Statistics
2(22)
Introduction
4(2)
An Overview of the Book
6(5)
Excel versus Stand-alone Statistical Software
11(1)
A Sampling of Examples
12(9)
Conclusion
21(3)
Case Study: Entertainment on a Cruise Ship
22(2)
Describing Data: Graphs and Tables
24(48)
Introduction
26(1)
Basic Concepts
27(4)
Frequency Tables and Histograms
31(11)
Analyzing Relationships with Scatterplots
42(4)
Time Series Plots
46(5)
Exploring Data with Pivot Tables
51(9)
Pivot Table Changes in Excel 2000
60(3)
Conclusion
63(9)
Case Study: Customer Arrivals at Bank98
70(1)
Case Study: Automobile Production and Purchases
70(1)
Case Study: Saving, Spending, and Social Climbing
71(1)
Describing Data: Summary Measures
72(52)
Introduction
74(1)
Measures of Central Location
74(2)
Quartiles and Percentiles
76(1)
Minimum, Maximum, and Range
77(1)
Measures of Variability: Variance and Standard Deviation
78(4)
Obtaining Summary Measures with Add-Ins
82(5)
Measures of Association: Covariance and Correlation
87(4)
Describing Data Sets with Boxplots
91(4)
Applying the Tools
95(17)
Conclusion
112(12)
Case Study: The Dow-Jones Averages
120(2)
Case Study: Other Market Indexes
122(2)
Getting the Right Data in Excel
124(54)
Introduction
126(1)
Cleaning the Data
127(9)
Using Excel's AutoFilter
136(7)
Complex Queries with the Advanced Filter
143(7)
Importing External Data from Access
150(12)
Creating Pivot Tables from External Data
162(3)
Web Queries
165(10)
Conclusion
175(3)
Case Study: EduToys, Inc.
176(2)
Probability and Probability Distributions
178(64)
Introduction
180(1)
Probability Essentials
181(6)
Distribution of a Single Random Variable
187(4)
An Introduction to Simulation
191(5)
Subjective Versus Objective Probabilities
196(2)
Derived Probability Distributions
198(4)
Distribution of Two Random Variables: Scenario Approach
202(7)
Distribution of Two Random Variables: Joint Probability Approach
209(10)
Independent Random Variables
219(5)
Weighted Sums of Random Variables
224(7)
Conclusion
231(11)
Case Study: Simpson's Paradox
240(2)
Normal, Binomial, and Poisson Distributions
242(56)
Introduction
244(1)
The Normal Distribution
245(9)
Applications of the Normal Distribution
254(12)
The Binomial Distribution
266(4)
Applications of the Binomial Distribution
270(12)
The Poisson Distribution
282(4)
Fitting a Probability Distribution to Data: BestFit
286(3)
Conclusion
289(9)
Case Study: EuroWatch Company
295(1)
Case Study: Cashing in on the Lottery
296(2)
Decision Making Under Uncertainty
298(78)
Introduction
300(1)
Elements of a Decision Analysis
301(11)
The Precision Tree Add-In
312(10)
Introduction to Influence Diagrams
322(6)
More Single-Stage Examples
328(10)
Multistage Decision Problems
338(9)
Bayes' Rule
347(8)
Incorporating Attitudes Toward Risk
355(8)
Conclusion
363(13)
Case Study: Jogger Shoe Company
374(1)
Case Study: Westhouser Paper Company
374(2)
Sampling and Sampling Distributions
376(46)
Introduction
378(1)
Sampling Terminology
378(1)
Methods for Selecting Random Samples
379(16)
An Introduction to Estimation
395(17)
Conclusion
412(10)
Case Study: Sampling from Videocassette Renters
421(1)
Confidence Interval Estimation
422(64)
Introduction
424(1)
Sampling Distributions
425(4)
Confidence Interval for a Mean
429(5)
Confidence Interval for a Total
434(3)
Confidence Interval for a Proporation
437(5)
Confidence Interval for a Standard Deviation
442(4)
Confidence Interval for the Difference Between Means
446(12)
Confidence Interval for the Difference Between Proportions
458(8)
Controlling Confidence Interval Length
466(7)
Conclusion
473(13)
Case Study: Harrigan University Admissions
480(1)
Case Study: Employee Retention at D & Y
481(1)
Case Study: Delivery Times at SnowPea Restaurant
482(1)
Case Study: The Bodfish Lot Cruise
483(3)
Hypothesis Testing
486(60)
Introduction
488(1)
Concepts in Hypothesis Testing
489(6)
Hypothesis Tests for a Population Mean
495(10)
Hypothesis Tests for Other Parameters
505(21)
Tests for Normality
526(6)
Chi-Square Test for Independence
532(5)
Conclusion
537(9)
Case Study: Regression Toward the Mean
542(1)
Case Study: Baseball Statistics
543(1)
Case Study: The Wichita Anti-Drunk Driving Advertising Campaign
543(3)
Statistical Process Control
546(62)
Introduction
549(1)
Deming's 14 Points
550(3)
Basic Ideas Behind Control Charts
553(2)
Control Charts for Variables
555(20)
Control Charts for Attributes
575(8)
Process Capability
583(11)
Conclusion
594(14)
Case Study: The Lamination Process at Intergalactica
599(2)
Case Study: Paper Production for Fornax at the Pluto Mill
601(7)
Analysis of Variance and Experimental Design
608(46)
Introduction
610(3)
One-Way ANOVA
613(12)
The Multiple Comparison Problem
625(6)
Two-Way ANOVA
631(12)
More About Experimental Design
643(9)
Conclusion
652(2)
Case Study: Krentz Appraisal Services
653(1)
Regression Analysis: Estimating Relationships
654(68)
Introduction
656(2)
Scatterplots: Graphing Relationships
658(9)
Correlations: Indicators of Linear Relationships
667(2)
Simple Linear Regression
669(10)
Multiple Regression
679(6)
Modeling Possibilities
685(26)
Validation of the Fit
711(2)
Conclusion
713(9)
Case Study: Quantity Discounts at the FirmChair Company
720(1)
Case Study: Housing Price Structure in MidCity
720(1)
Case Study: Demand for French Bread at Howie's
721(1)
Case Study: Investing for Retirement
721(1)
Regression Analysis: Statistical Inference
722(75)
Introduction
724(1)
The Statistical Model
725(3)
Inferences About the Regression Coefficients
728(6)
Multicollinearity
734(4)
Include/Exclude Decisions
738(5)
Stepwise Regression
743(5)
A Test for the Overall Fit: The ANOVA Table
748(4)
The Partial F Test
752(9)
Outliers
761(6)
Violations of Regression Assumptions
767(4)
Prediction
771(8)
Conclusion
779(18)
Case Study: The Artsy Corporation
790(1)
Case Study: Heating Oil at Dupree Fuels Company
791(2)
Case Study: Developing a Flexible Budget at the Gunderson Plant
793(1)
Case Study: Forecasting Overhead at Wagner Printers
794(3)
Discriminant Analysis and Logistic Regression
797(39)
Introduction
799(1)
Discriminant Analysis
800(19)
Logistic Regression
819(15)
Choosing Between the Two Methods
834(1)
Conclusion
834(2)
Case Study: Understanding Cereal Brand Preferences
835(1)
Time Series Analysis and Forecasting
836(70)
Introduction
838(1)
Forecasting Methods: An Overview
839(4)
Random Series
843(10)
The Random Walk Model
853(4)
Autoregression Models
857(6)
Regression-Based Trend Models
863(7)
Moving Averages
870(6)
Exponential Smoothing
876(14)
Deseasonalizing: The Ratio-to-Moving-Averages Method
890(4)
Estimating Seasonality with Regression
894(5)
Econometric Models
899(1)
Conclusion
900(6)
Case Study: Arrivals at the Credit Union
904(1)
Case Study: Forecasting Weekly Sales at Amanta
904(2)
Statistical Reporting
906(20)
Introduction
907(1)
Suggestions for Good Statistical Report Writing
908(5)
Examples of Statistical Reports
913(12)
Conclusion
925(1)
References 926(3)
Index 929

Supplemental Materials

What is included with this book?

The New copy of this book will include any supplemental materials advertised. Please check the title of the book to determine if it should include any access cards, study guides, lab manuals, CDs, etc.

The Used, Rental and eBook copies of this book are not guaranteed to include any supplemental materials. Typically, only the book itself is included. This is true even if the title states it includes any access cards, study guides, lab manuals, CDs, etc.

Rewards Program