did-you-know? rent-now

Rent More, Save More! Use code: ECRENTAL

did-you-know? rent-now

Rent More, Save More! Use code: ECRENTAL

5% off 1 book, 7% off 2 books, 10% off 3+ books

9781118840313

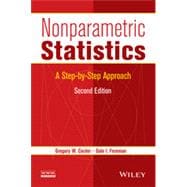
Nonparametric Statistics A Step-by-Step Approach

by ;
  • ISBN13:

    9781118840313

  • ISBN10:

    1118840313

  • Edition: 2nd
  • Format: Hardcover
  • Copyright: 2014-05-12
  • Publisher: Wiley

Note: Supplemental materials are not guaranteed with Rental or Used book purchases.

Purchase Benefits

  • Free Shipping Icon Free Shipping On Orders Over $35!
    Your order must be $35 or more to qualify for free economy shipping. Bulk sales, PO's, Marketplace items, eBooks and apparel do not qualify for this offer.
  • eCampus.com Logo Get Rewarded for Ordering Your Textbooks! Enroll Now
List Price: $112.66 Save up to $45.06
  • Rent Book $67.60
    Add to Cart Free Shipping Icon Free Shipping

    TERM
    PRICE
    DUE
    USUALLY SHIPS IN 24-48 HOURS
    *This item is part of an exclusive publisher rental program and requires an additional convenience fee. This fee will be reflected in the shopping cart.

How To: Textbook Rental

Looking to rent a book? Rent Nonparametric Statistics A Step-by-Step Approach [ISBN: 9781118840313] for the semester, quarter, and short term or search our site for other textbooks by Corder, Gregory W.; Foreman, Dale I.. Renting a textbook can save you up to 90% from the cost of buying.

Summary

“…a very useful resource for courses in nonparametric statistics in which the emphasis is on applications rather than on theory.  It also deserves a place in libraries of all institutions where introductory statistics courses are taught." –CHOICE

This Second Edition presents a practical and understandable approach that enhances and expands the statistical toolset for readers. This book includes:

  • New coverage of the sign test and the Kolmogorov-Smirnov two-sample test in an effort to offer a logical and natural progression to statistical power
  • SPSS® (Version 21) software and updated screen captures to demonstrate how to perform and recognize the steps in the various procedures
  • Data sets and odd-numbered solutions provided in an appendix, and tables of critical values
  • Supplementary material to aid in reader comprehension, which includes: narrated videos and screen animations with step-by-step instructions on how to follow the tests using SPSS; online decision trees to help users determine the needed type of statistical test; and additional solutions not found within the book. 

Author Biography

Greg W. Corder is Adjunct Instructor in the Department of Physics and Astronomy at James Madison University.  He is also Adjunct Instructor of graduate education at Mary Baldwin College. 

Dale I. Foreman is Professor Emeritus in the School of Education and Human Development at Shenandoah University.

Table of Contents

Preface

Chapter 1: Nonparametric Statistics: An Introduction

1.1. Objectives

1.2. Introduction

1.3. The Nonparametric Statistical Procedures Presented In This Book

1.4. Ranking Data

1.5. Ranking Data with Tied Values

1.6. Counts Of Observations

1.7. Summary

1.8. Practice Questions

1.9 Solutions To Practice Questions

Chapter 2: Testing Your Data For Normality

2.1. Objectives

2.2. Introduction

2.3. Describing Data and The Normal Distribution

2.4. Computing And Testing Kurtosis And Skewness For Sample Normality

2.4.1. Sample Problem For Examining Kurtosis

2.4.2. Sample Problem For Examining Skewness

2.4.3. Examining Skewness And Kurtosis For Normality Using SPSS

2.5. The Kolmogorov-Smirnov One-Sample Test

2.5.1. Sample Kolmogorov-Smirnov One-Sample Test

2.5.2. Performing The Kolmogorov-Smirnov One-Sample Test Using SPSS

2.6. Summary

2.7. Practice Questions

2.8. Solutions To Practice Questions

Chapter 3: Comparing Two Related Samples: The Wilcoxon Signed Ranks Test

3.1. Objectives

3.2. Introduction

3.3. Computing The Wilcoxon Signed Ranks Test Statistic

3.3.1. Sample Wilcoxon Signed Ranks Test For Small Samples

3.3.2. Confidence Interval for the Wilcoxon Signed Ranks Test

3.3.3. Sample Wilcoxon Signed Ranks Test For Large Samples

3.4. Computing the Sign Test

3.4.1. Sample Sign Test For Small Samples

3.4.2. Sample Sign Test For Large Samples

3.5. Performing the Wilcoxon Signed Ranks Test Using SPSS

3.6. Statistical Power

3.7. Examples from the Literature

3.8. Summary

3.9. Practice Questions

3.10. Solutions to Practice Questions

Chapter 4: Comparing Two Unrelated Samples: The Mann-Whitney U Test

4.1. Objectives

4.2. Introduction

4.3. Computing the Mann-Whitney U Test Statistic

4.3.1. Sample Mann-Whitney U Test For Small Samples

4.3.3. Confidence Interval for the Difference Between Two Location Parameters

4.3.4. Sample Mann-Whitney U Test For Large Samples

4.4. Computing the Kolmogorov-Smirnov Two-Sample Test Statistic

4.4.1 Sample Kolmogorov-Smirnov Two-Sample Test

4.5. Performing the Mann-Whitney U Test and the Kolmogorov-Smirnov Two-Sample Test Using SPSS

4.6. Examples From The Literature

4.7. Summary

4.8. Practice Questions

4.9. Solutions to Practice Questions

Chapter 5: Comparing More Than Two Related Samples: Friedman’s Test

5.1. Objectives

5.2. Introduction

5.3. Computing The Friedman’s Test Statistic

5.3.1. Sample Friedman’s Test (Small Data Samples without Ties)

5.3.2. Sample Friedman’s Test (Small Data Samples with Ties)

5.3.3. Performing The Friedman’s Test Using SPSS

5.3.4. Sample Friedman’s Test (Large Data Samples without Ties)

5.4. Examples From The Literature

5.5. Summary

5.6. Practice Questions

5.7. Solutions to Practice Questions

Chapter 6: Comparing More Than Two Unrelated Samples: Kruskal-Wallis H Test

6.1. Objectives

6.2. Introduction

6.3. Computing The Kruskal-Wallis H Test Statistic

6.3.1. Sample Kruskal-Wallis H Test (Small Data Samples)

6.3.2. Performing The Kruskal-Wallis H Test Using SPSS

6.3.3. Sample Kruskal-Wallis H Test (Large Data Samples)

6.4. Examples From The Literature

6.5. Summary

6.6. Practice Questions

6.7. Solutions To Practice Questions

Chapter 7: Comparing Variables Of Ordinal Or Dichotomous Scales: Spearman Rank-Order, Point-Biserial, And Biserial Correlations

7.1. Objectives

7.2. Introduction

7.3. The Correlation Coefficient

7.4. Computing The Spearman Rank-Order Correlation Coefficient

7.4.1. Sample Spearman Rank-Order Correlation (Small Data Sample without Ties)

7.4.2. Sample Spearman Rank-Order Correlation (Small Data Sample with Ties)

7.4.3. Performing The Spearman Rank-Order Correlation Using SPSS

7.5. Computing the Point-Biserial and Biserial Correlation Coefficients

7.5.1. Correlation of a dichotomous variable and an interval scale variable.

7.5.2. Correlation of a dichotomous variable and a rank-order variable.

7.5.3. Sample Point-Biserial Correlation (Small Data Samples)

7.5.4. Performing The Point-Biserial Correlation Using SPSS

7.5.5. Sample Point-Biserial Correlation (Large Data Samples)

7.5.6. Sample Biserial Correlation (Small Data Samples)

7.5.7. Performing The Point-Biserial Correlation Using SPSS

7.6. Examples From The Literature

7.7. Summary

7.8. Practice Questions

7.9. Solutions To Practice Questions

Chapter 8: Tests For Nominal Scale Data: Chi-Square Tests

8.1. Objectives

8.2. Introduction

8.3. The Chi-Square Goodness-of-Fit Test

8.3.1. Computing The Chi-Square Goodness-of-Fit Test Statistic

8.3.2. Sample Chi-Square Goodness-Of-Fit Test (Category Frequencies Equal)

8.3.3. Sample Chi-Square Goodness-Of-Fit Test (Category Frequencies Not Equal)

8.3.4. Performing The Chi-Squared Goodness-Of-Fit Test Using SPSS

8.4. Chi-Square Test Of Independence

8.4.1. Computing the Chi-Square Test Of Independence

8.4.2. Sample Chi-Square Test Of Independence

8.4.3. Performing The Chi-Square Test Of Independence Using SPSS

8.5. The Fisher Exact Test

8.5.1. Computing the Fisher Exact Test for 2 ´ 2 Tables

8.5.2. Sample Fisher Exact Test

8.5.3. Performing the Fisher Exact Test Using SPSS

8.6. Examples From The Literature

8.7. Summary

8.8. Practice Questions

8.9. Solutions To Practice Questions

Chapter 9: Test For Randomness: Runs Test

9.1. Objectives

9.2. Introduction

9.3. The Runs Test For Randomness

9.3.1. Sample Runs Test (Small Data Samples)

9.3.2. Performing The Runs Test Using SPSS

9.3.3. Sample Runs Test (Large Data Samples)

9.3.4. Sample Runs Test Referencing A Custom Value

9.3.5. Performing The Runs Test For A Custom Value Using SPSS

9.4. Examples From The Literature

9.5. Summary

9.6. Practice Questions

9.7. Solutions To Practice Questions

Appendix A: SPSS at a Glance

A.1. Introduction

A.2. Opening SPSS

A.3. Inputting Data

A.4. Analyzing Data

A.5. The SPSS Output

Appendix B: Tables of Critical Values

Table B.1: The Normal Distribution

Table B.2: Chi-Squared Distribution

Table B.3: Critical Values for the Wilcoxon Signed Rank Test Statistics, T.

Table B.4: Critical Values for the Mann-Whitney U Test Statistic.

Table B.5: Critical Values for the Friedman Test Statistic, Fr.

Table B.6: The Critical Values for the Kruskal-Wallis H Test Statistic.

Table B.7: Critical Values for the Spearman Rank-Order Correlation Coefficient, rs.

Table B.8: Critical Values for the Pearson Product-Moment Correlation Coefficient, r.

Table B.9: Factorials.

Table B.10: Critical Values for the Runs Test for Randomness.

Supplemental Materials

What is included with this book?

The New copy of this book will include any supplemental materials advertised. Please check the title of the book to determine if it should include any access cards, study guides, lab manuals, CDs, etc.

The Used, Rental and eBook copies of this book are not guaranteed to include any supplemental materials. Typically, only the book itself is included. This is true even if the title states it includes any access cards, study guides, lab manuals, CDs, etc.

Rewards Program