rent-now

Rent More, Save More! Use code: ECRENTAL

5% off 1 book, 7% off 2 books, 10% off 3+ books

9781405146500

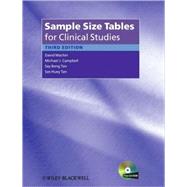
Sample Size Tables for Clinical Studies

by ; ; ;
  • ISBN13:

    9781405146500

  • ISBN10:

    1405146508

  • Edition: 3rd
  • Format: Hardcover
  • Copyright: 2008-12-15
  • Publisher: B M J Books
  • Purchase Benefits
  • Free Shipping Icon Free Shipping On Orders Over $35!
    Your order must be $35 or more to qualify for free economy shipping. Bulk sales, PO's, Marketplace items, eBooks and apparel do not qualify for this offer.
  • eCampus.com Logo Get Rewarded for Ordering Your Textbooks! Enroll Now
List Price: $131.95 Save up to $0.13
  • Buy New
    $131.82
    Add to Cart Free Shipping Icon Free Shipping

    PRINT ON DEMAND: 2-4 WEEKS. THIS ITEM CANNOT BE CANCELLED OR RETURNED.

Summary

This book provides statisticians and researchers with the statistical tools - equations, formulae and numerical tables - to design and plan clinical studies and carry out accurate, reliable and reproducible analysis of the data so obtained. There is no way around this as incorrect procedure in clinical studies means that the researcher's paper will not be accepted by a peer-reviewed journal. Planning and analysing clinical studies is a very complicated business and this book provides indispensible factual information.

Author Biography


David Machin, Children’s Cancer and Leukaemia Group, University of Leicester, UK; Division of Clinical Trials and Epidemiological Sciences, National Cancer Centre, Singapore; Medical Statistics Unit, School of Health and Related Sciences, University of Sheffield, UK

Michael J. Campbell, Medical Statistics Unit, School of Health and Related Sciences, University of Sheffield, UK

Say Beng Tan, Singapore Clinical Research Institute, Singapore; Duke–NUS Graduate Medical School, Singapore

Sze Huey Tan, Division of Clinical Trials and Epidemiological Sciences, National Cancer Centre, Singapore

Table of Contents

Preface, viii.1 Basic design considerations, 1.2 Distributions and confidence intervals, 14.Table 2.1 The Normal distribution functionaprobability that a Normally.distributed variable is less than z, 27.Table 2.2 Percentage points of the Normal distribution for α and 1 'ˆ’ β, 28.Table 2.3 Values of θ(α, β) = (z1'ˆ’α/2 + z1'ˆ’β)2, 28.Table 2.4 The t-distribution, 29.3 Comparing two independent groups for binary data, 30.Table 3.1 Sample size for the comparison of two proportions, 38.Table 3.2 Sample size for the comparison of two proportions using the odds.ratio (OR), 40.4 Comparing two independent groups for ordered.categorical data, 42.5 Comparing two independent groups for continuous data, 47.Table 5.1 Sample sizes for the two sample t-test with two-sided α = 0.05, 54.Table 5.2 Sample sizes for the two sample t-test with unequal variances, 55.Table 5.3 Sample sizes for the one sample t-test with two-sided α = 0.05, 57.6 Cluster designs, repeated measures data and more than.two groups, 58.Table 6.1 Multiplying factor for repeated measures designs, 66.7 Comparing paired groups for binary, ordered categorical and.continuous outcomes, 67.Table 7.1 Sample sizes for paired binary data, 80.Table 7.2 Sample sizes for paired continuous data with two-sided α = 0.05, 81.8 Comparing survival curves, 82.Table 8.1 Number of critical events for comparison of survival rates (Logrank test), 95.Table 8.2 Number of subjects for comparison of survival rates (Logrank test), 97.Table 8.3 Number of critical events for comparison of two exponential survival.distributions with two-sided α = 0.05, 99.9 Equivalence, 100.Table 9.1 Sample sizes for bioequivalence studiesadifference between two means or.ratio of two means, 115.Table 9.2 Sample sizes for testing the equivalence of two means, 116.Table 9.3 Sample sizes for testing the equivalence of two proportions, 118.10 Confidence intervals, 120.Table 10.1 Sample sizes required to observe a given confidence interval width for a.given proportion in a sample from a large population, 134.Table 10.2 Sample sizes required to observe a given confidence interval width for the.difference between two proportionsaindependent groups, 135.Table 10.3 Sample sizes required to observe a proportionate confidence interval width.for the difference between two groups expressed via the odds ratio (OR), 136.Table 10.4 Sample sizes required to observe a given confidence interval width for the.difference between two proportions from paired or matched groups, 137.Table 10.5 Sample sizes required to observe a given confidence interval width to.estimate a single mean or the difference between two means for independent or.matched groups, 139.11 Post-marketing surveillance, 140.Table 11.1 Sample sizes required to observe a total of a adverse reactions with a given.probability 1 'ˆ’ β and anticipated incidence λ, 147.Table 11.2 Sample sizes required for detection of a specific adverse reaction with.background incidence, λ0, known, 148.Table 11.3 Sample sizes required for detection of a specific adverse reaction with.background incidence unknown, 149.Table 11.4 Number of cases to be observed in a case-control study, 150.12 The correlation coefficient, 151.Table 12.1 Sample sizes for de

Supplemental Materials

What is included with this book?

The New copy of this book will include any supplemental materials advertised. Please check the title of the book to determine if it should include any access cards, study guides, lab manuals, CDs, etc.

The Used, Rental and eBook copies of this book are not guaranteed to include any supplemental materials. Typically, only the book itself is included. This is true even if the title states it includes any access cards, study guides, lab manuals, CDs, etc.

Rewards Program