did-you-know? rent-now

Amazon no longer offers textbook rentals. We do!

did-you-know? rent-now

Amazon no longer offers textbook rentals. We do!

We're the #1 textbook rental company. Let us show you why.

9780970601971

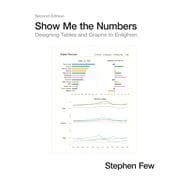
Show Me the Numbers : Designing Tables and Graphs to Enlighten

by
  • ISBN13:

    9780970601971

  • ISBN10:

    0970601972

  • Edition: 2nd
  • Format: Hardcover
  • Copyright: 2012-06-01
  • Publisher: Analytics Press

Note: Supplemental materials are not guaranteed with Rental or Used book purchases.

Purchase Benefits

  • Free Shipping Icon Free Shipping On Orders Over $35!
    Your order must be $35 or more to qualify for free economy shipping. Bulk sales, PO's, Marketplace items, eBooks and apparel do not qualify for this offer.
  • eCampus.com Logo Get Rewarded for Ordering Your Textbooks! Enroll Now
  • Buyback Icon We Buy This Book Back!
    In-Store Credit: $5.25
    Check/Direct Deposit: $5.00
    PayPal: $5.00
List Price: $48.00 Save up to $24.00
  • Rent Book $24.00
    Add to Cart Free Shipping Icon Free Shipping

    TERM
    PRICE
    DUE
    USUALLY SHIPS IN 24-48 HOURS
    *This item is part of an exclusive publisher rental program and requires an additional convenience fee. This fee will be reflected in the shopping cart.

Supplemental Materials

What is included with this book?

Summary

Addressing the prevalent issue of poorly designed quantitative information presentations, this accessible, practical, and comprehensive guide teaches how to properly create tables and graphs for effective and efficient communication. The critical numbers that measure the health, identify the opportunities, and forecast the future of organizations are often misrepresented because few people are trained to design accurate, informative materials, but this manual helps put an end to misinformation. This revised edition of the highly successful book includes updated figures and 91 additional pages of content, including new chapters about quantitative narrative and current misuses of graphssuch as donut, circle, unit, and funnel chartsand new appendices that cover constructing table lens displays and box plots in Excel and useful color palettes for presentation materials.

Author Biography

Stephen Few is the founder of the consultancy Perceptual Edge. He speaks, teaches, and consults around the world and writes the quarterly Visual Business Intelligence Newsletter. He is the author of Information Dashboard Design: The Effective Visual Communication of Data and Now You See It: Simple Visualization Techniques for Quantitative Analysis. He lives in Berkeley, California.

Supplemental Materials

What is included with this book?

The New copy of this book will include any supplemental materials advertised. Please check the title of the book to determine if it should include any access cards, study guides, lab manuals, CDs, etc.

The Used, Rental and eBook copies of this book are not guaranteed to include any supplemental materials. Typically, only the book itself is included. This is true even if the title states it includes any access cards, study guides, lab manuals, CDs, etc.

Rewards Program