did-you-know? rent-now

Amazon no longer offers textbook rentals. We do!

did-you-know? rent-now

Amazon no longer offers textbook rentals. We do!

We're the #1 textbook rental company. Let us show you why.

9780471288787

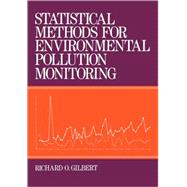
Statistical Methods for Environmental Pollution Monitoring

by
  • ISBN13:

    9780471288787

  • ISBN10:

    0471288780

  • Edition: 1st
  • Format: Hardcover
  • Copyright: 1987-02-15
  • Publisher: Wiley
  • Purchase Benefits
  • Free Shipping Icon Free Shipping On Orders Over $35!
    Your order must be $35 or more to qualify for free economy shipping. Bulk sales, PO's, Marketplace items, eBooks and apparel do not qualify for this offer.
  • eCampus.com Logo Get Rewarded for Ordering Your Textbooks! Enroll Now
List Price: $221.81 Save up to $0.11
  • Buy New
    $221.70
    Add to Cart Free Shipping Icon Free Shipping

    PRINT ON DEMAND: 2-4 WEEKS. THIS ITEM CANNOT BE CANCELLED OR RETURNED.

Supplemental Materials

What is included with this book?

Summary

This book discusses a broad range of statistical design and analysis methods that are particularly well suited to pollution data. It explains key statistical techniques in easy-to-comprehend terms and uses practical examples, exercises, and case studies to illustrate procedures. Dr. Gilbert begins by discussing a space-time framework for sampling pollutants. He then shows how to use statistical sample survey methods to estimate average and total amounts of pollutants in the environment, and how to determine the number of field samples and measurements to collect for this purpose. Then a broad range of statistical analysis methods are described and illustrated. These include: determining the number of samples needed to find hot spots analyzing pollution data that are lognormally distributed testing for trends over time or space estimating the magnitude of trends comparing pollution data from two or more populations New areas discussed in this sourcebook include statistical techniques for data that are correlated, reported as less than the measurement detection limit, or obtained from field-composited samples. Nonparametric statistical analysis methods are emphasized since parametric procedures are often not appropriate for pollution data. This book also provides an illustrated comprehensive computer code for nonparametric trend detection and estimation analyses as well as nineteen statistical tables to permit easy application of the discussed statistical techniques. In addition, many publications are cited that deal with the design of pollution studies and the statistical analysis of pollution data. This sourcebook will be a useful tool for applied statisticians, ecologists, radioecologists, hydrologists, biologists, environmental engineers, and other professionals who deal with the collection, analysis, and interpretation of pollution in air, water, and soil.

Author Biography

Richard O. Gilbert is the author of Statistical Methods for Environmental Pollution Monitoring, published by Wiley.

Table of Contents

Preface ix
Introduction
1(4)
Types and Objectives of Environmental Pollution Studies
1(1)
Statistical Design and Analysis Problems
2(1)
Overview of the Design and analysis Process
3(1)
Summary
4(1)
Sampling Environmental Populations
5(12)
Sampling in Space and Time
5(2)
Target and Sampled Populations
7(2)
Representative Units
9(1)
Choosing a Sampling Plan
10(1)
Variability and Error in Environmental Studies
10(3)
Case Study
13(2)
Summary
15(2)
Environmental Sampling Design
17(9)
Introduction
17(1)
Criteria for Choosing a Sampling Plan
17(2)
Methods for Selecting Sampling Locations and Times
19(5)
Summary
24(2)
Simple Random Sampling
26(19)
Basic Concepts
26(1)
Estimating the Mean and Total Amount
27(3)
Effect of Measurement Errors
30(1)
Number of Measurement: Independent Data
30(5)
Number of Measurement: Correlated Data
35(7)
Estimating Var(x)
42(1)
Summary
43(2)
Stratified Random Sampling
45(13)
Basic Concepts
45(1)
Estimating the Mean
46(1)
Estimating the Total Amount
47(1)
Arbitrary Selection of Strata
48(2)
Allocation of Samples of Strata
50(1)
Number of Samples
51(2)
Case Study
53(1)
Summary
54(4)
Two-Stage Sampling
58(13)
Basic Concepts
58(1)
Primary Units of Equal size
59(5)
Primary Units of Unequal Size
64(5)
Summary
69(2)
Compositing and Three-Stage Sampling
71(18)
Basic Concepts
72(1)
Equal-Sized Unites
72(7)
Unequal-Sized Units
79(6)
Summary
85(4)
Systematic Sampling
89(17)
Sampling along a Line
90(3)
Sampling over Space
93(1)
Comparing Systematic with Random Sampling
94(2)
Estimating the Mean and Variance
96(3)
Population with Trends
99(1)
Estimating Var(x) from a Single Systematic Sample
100(2)
Estimating Spatial Distribution
102(1)
Summary
103(3)
Double Sampling
106(13)
Linear Regression Double Sampling
106(5)
Ratio Double Sampling
111(1)
Case Study
112(5)
Summary
117(2)
Locating Hot Spots
119(13)
Determining Grid Spacing
121(4)
Size of Hot Spot Likely to be Hit
125(1)
Probability of Not Hitting a Hot Spot
125(2)
Taking Prior Information into Account
127(1)
Probability that a Hot Spot Exists When None Has Been Found
128(1)
Choosing the consumer's Risk
129(2)
Summary
131(1)
Quantiles, Proportions, and Means
132(20)
Basic Concepts
132(2)
Estimating Quantiles (Percentiles)
134(2)
Confidence Limits for Quantiles
136(1)
Estimating Proportions
136(1)
Two-Sided Confidence Limits for the Mean
137(1)
One-Sided confidence Limits for the Mean
138(1)
Approximate Confidence Limits for the Mean
139(1)
Alternative Estimators for the Mean and Standard Deviation
140(1)
Nonparametric Estimators of Quantiles
141(1)
Nonparametric Confidence Limits for Quantiles
141(1)
Nonparametric Confidence Limits for Proportions
142(2)
Confidence Limits When Data Are Correlated
144(2)
Rank Von Neumann Test for Serial Correlation
146(2)
Data Transformations
148(1)
Summary
149(3)
Skewed Distribution and Goodness-of-Fit Tests
152(12)
Lognormal Distribution
152(3)
Weibull, Gamma, and Beta Distribution
155(2)
Goodness-of-Fit Tests
157(5)
Summary
162(2)
Characterizing Lognormal Populations
164(13)
Estimating the Mean and Variance
164(5)
Confidence Limits for the Mean
169(2)
Estimating the Median
171(2)
Confidence Limits for the Median
173(1)
Choosing n for Estimating the Median
174(1)
Estimating Quantiles
174(1)
Summary
175(2)
Estimating the Mean and Variance from Censored Data Sets
177(9)
Data Near Detection Limits
177(1)
Estimators of the Mean and Variance
178(3)
Two-Parameter Lognormal Distribution
181(3)
Three-Parameter Lognormal Distribution
184(1)
Summary
184(2)
Outlier Detection and Control Charts
186(18)
Data Screening and Validation
186(1)
Treatment of Outliers
187(1)
Rosner's Test for Detecting up to k Outliers
188(3)
Detecting Outliers in Correlated Variables
191(1)
Other Outlier Tests
192(1)
Control Charts
193(9)
Summary
202(2)
Detecting and Estimating Trends
204(21)
Types of Trends
204(1)
Statistical Complexities
205(2)
Methods
207(1)
Mann-Kendall Test
208(9)
Sen's Nonparametric Estimator of Slope
217(2)
Case Study
219(4)
Summary
223(2)
Trends and Seasonality
225(16)
Seasonal Kendall Test
225(2)
Seasonal Kendall Slope Estimator
227(1)
Homogeneity of Trends in Different Seasons
228(2)
Sen's Test for Trend
230(1)
Testing for Global Trends
231(5)
Summary
236(5)
Comparing Populations
241(13)
Tests Using Paired Data
241(6)
Independent Data Sets
247(5)
Summary
252(2)
Appendix A: Statistical Tables 254(20)
Appendix B: TREND 274(22)
Symbols 296(3)
Glossary 299(2)
Bibliography 301(14)
Index 315

Supplemental Materials

What is included with this book?

The New copy of this book will include any supplemental materials advertised. Please check the title of the book to determine if it should include any access cards, study guides, lab manuals, CDs, etc.

The Used, Rental and eBook copies of this book are not guaranteed to include any supplemental materials. Typically, only the book itself is included. This is true even if the title states it includes any access cards, study guides, lab manuals, CDs, etc.

Rewards Program