rent-now

Rent More, Save More! Use code: ECRENTAL

5% off 1 book, 7% off 2 books, 10% off 3+ books

9781119671633

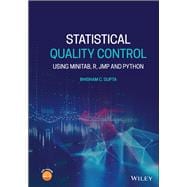
Statistical Quality Control Using MINITAB, R, JMP and Python

by
  • ISBN13:

    9781119671633

  • ISBN10:

    1119671639

  • Edition: 1st
  • Format: Hardcover
  • Copyright: 2021-04-27
  • Publisher: Wiley

Note: Supplemental materials are not guaranteed with Rental or Used book purchases.

Purchase Benefits

  • Free Shipping Icon Free Shipping On Orders Over $35!
    Your order must be $35 or more to qualify for free economy shipping. Bulk sales, PO's, Marketplace items, eBooks and apparel do not qualify for this offer.
  • eCampus.com Logo Get Rewarded for Ordering Your Textbooks! Enroll Now
List Price: $137.54 Save up to $39.54
  • Rent Book $98.00
    Add to Cart Free Shipping Icon Free Shipping

    TERM
    PRICE
    DUE
    USUALLY SHIPS IN 3-4 BUSINESS DAYS
    *This item is part of an exclusive publisher rental program and requires an additional convenience fee. This fee will be reflected in the shopping cart.

How To: Textbook Rental

Looking to rent a book? Rent Statistical Quality Control Using MINITAB, R, JMP and Python [ISBN: 9781119671633] for the semester, quarter, and short term or search our site for other textbooks by Gupta, Bhisham C.. Renting a textbook can save you up to 90% from the cost of buying.

Summary

STATISTICAL QUALITY CONTROL

Provides a basic understanding of statistical quality control (SQC) and demonstrates how to apply the techniques of SQC to improve the quality of products in various sectors

This book introduces Statistical Quality Control and the elements of Six Sigma Methodology, illustrating the widespread applications that both have for a multitude of areas, including manufacturing, finance, transportation, and more. It places emphasis on both the theory and application of various SQC techniques and offers a large number of examples using data encountered in real life situations to support each theoretical concept.

Statistical Quality Control: Using MINITAB, R, JMP and Python begins with a brief discussion of the different types of data encountered in various fields of statistical applications and introduces graphical and numerical tools needed to conduct preliminary analysis of the data. It then discusses the basic concept of statistical quality control (SQC) and Six Sigma Methodology and examines the different types of sampling methods encountered when sampling schemes are used to study certain populations. The book also covers Phase 1 Control Charts for variables and attributes; Phase II Control Charts to detect small shifts; the various types of Process Capability Indices (CPI); certain aspects of Measurement System Analysis (MSA); various aspects of PRE-control; and more. This helpful guide also

  • Focuses on the learning and understanding of statistical quality control for second and third year undergraduates and practitioners in the field
  • Discusses aspects of Six Sigma Methodology
  • Teaches readers to use MINITAB, R, JMP and Python to create and analyze charts
  • Requires no previous knowledge of statistical theory
  • Is supplemented by an instructor-only book companion site featuring data sets and a solutions manual to all problems, as well as a student book companion site that includes data sets and a solutions manual to all odd-numbered problems

Statistical Quality Control: Using MINITAB, R, JMP and Python is an excellent book for students studying engineering, statistics, management studies, and other related fields and who are interested in learning various techniques of statistical quality control. It also serves as a desk reference for practitioners who work to improve quality in various sectors, such as manufacturing, service, transportation, medical, oil, and financial institutions. It‘s also useful for those who use Six Sigma techniques to improve the quality of products in such areas.

Author Biography

Bhisham C. Gupta, PhD, is Professor Emeritus of Statistics at the University of Southern Maine, where he has taught for 31 years. Prior to coming to USM as a full professor in 1985, Dr. Gupta served for 21 years at various institutions in Canada, Brazil, and India. He is the co-author of Statistics and Probability with Applications for Engineers and Scientists, First Edition and Second Edition, as well as the accompanying solutions manuals, all published by Wiley. He is also co-author of three books published by American Society for Quality (ASQ). 


Table of Contents

Chapter 1- QUALITY IMPROVEMENT AND MANAGEMENT1

1.1 Introduction  1

1.2 Statistical Quality Control 1

 1.2.1 Quality and the Customer 3

 1.2.2 Quality Improvement 4

 1.2.3 Quality and Productivity7

1.3 Implementing Quality Improvement  9

 1.3.1 Outcomes of Quality Control 10

 1.3.2 Quality Control and Quality Improvement 11

1.3.2.1 Removing Obstacles of Quality 13

1.3.2.2 Eliminating Productivity Quotas 14

 1.3.3 Implementation of Quality Improvement 14

1.4 Managing Quality Improvement 15

 1.4.1 Management and Their Responsibilities  16

 1.4.2 Management and Quality 17 

 1.4.3 Risks Associated with Making Bad decisions  18

Chapter 2 - BASIC CONCEPTS OF THE SIX SIGMA METHODOLOGY20

2.1 Introduction 20

2.2 What is Six Sigma? 20

 2.2.1 Six Sigma as Management Philosophy 21

 2.2.2 Six Sigma as a Systemic Approach Problem Solving  22

 2.2.3 Six Sigma as a Statistical Standard of Quality24

  2.2.3.1 Statistical Basis for Six Sigma 25

 2.2.4 Six Sigma Roles28

2.3 Is Six Sigma New? 29

2.4 Quality Tools Used in Six Sigma  30

 2.4.1 The Basic Seven Tools and the New Seven tools  31  

 2.4.2 Lean Tools  32

2.4.2.1 Eight Wastes   33

 2.4.2.2 Visual Management   36

2.4.2.3 The 5S Method 37

 2.4.2.4 Value Stream Mapping 38

 2.4.2.5 Mistake Proofing   39

 2.4.2.6 Quick Changeover39

2.5 Six Sigma Benefits and Criticism 40

 2.5.1 Why Do Some Six Sigma Initiatives Fail?  41

Review Practice Problems  42

Chapter 3- DESCRIBING QUANTITATIVE AND QUALITATIVE DATA 44

3.1 Introduction   44

3.2 Classification of Various Types of Data 44

3.3 Analyzing Data Using Graphical Tools   47

 3.3.1 Frequency Distribution Tables for Qualitative and Quantitative Data 48

3.4 Describing Data Graphically52

 3.4.1 Dot Plot 52

 3.4.2 Pie Chart   54

 3.4.3 Bar Chart   57

 3.4.4 Histograms62

 3.4.5 Line Graph65

 3.4.6 Measure of Association  67

3.5 Analyzing Data Using Numerical Tools 71

 3.5.1 Numerical Measures 71

 3.5.2 Measures of Centrality   72

 3.5.3 Measures of Dispersion  76

 3.5.4 Box Whisker Plot 85

3.6 Some Important Probability Distributions  87

 3.6.1 The Binomial Distribution 87

 3.6.2 The Hypergeometric Distribution  90

 3.6.3 The Poisson Distribution95

 3.6.4 The Normal Distribution99

Review Practice Problems107

Chapter 4 - SAMPLING METHODS 118

4.1 Introduction 118

4.2 Basic Concepts of Sampling 118

4.3 Simple Random Sampling123

 4.3.1 Estimation of a Population Mean and Population Total  125

 4.3.2 Confidence Interval for a Population Mean and Population Total 129

 4.3.3 Determination of Sample Size 130

4.4 Stratified Random Sampling 132

 4.4.1 Estimation of a Population Mean and Population Total  133

 4.4.2 Confidence Interval for a Population Mean and Population Total 135

 4.4.3 Determination of Sample Size 138

4.5 Systematic Random Sampling139

 4.5.1 Estimation of a Population Mean and Population Total  140

 4.5.2 Confidence Interval for a Population Mean and Population Total 142

 4.5.3 Determination of Sample Size 142

4.6 Cluster Random Sampling145

 4.6.1 Estimation of a Population Mean and Population Total  146

 4.6.2 Confidence Interval for a Population Mean and Population Total 148

 4.6.3 Determination of Sample Size 150

Review Practice Problems 151

Chapter 5 - Phase I Quality Control Charts for Variables   157

5.1 Introduction 157

5.2 Basic Definition of Quality and its Benefits158

5.3 Statistical Process Control159

5.4 Control Charts for Variables 170

 5.4.1 Shewhart and R Control Chart   181

5.4.1.1 Interpretation of Shewhart and R Control Charts  189

5.4.1.2 Extending the Current Control Limits for Future Control 191

5.5 Shewhart and R Control Charts when Process Mean and Standard Deviation  Known  194

 5.5.1 Shewhart and Control Chart for Individual Observations  196

 5.5.2 Shewhart and S Control Chart – Equal Sample size 201

 5.5.3 Shewhart and S Control Chart - Sample Size Variable  206

5.6 Process Capability211

Review Practice Problems 213

Chapter 6 - Phase I Control Charts for Attributes 223

6.1 Introduction 223

6.2 Control Charts for Attributes 223

6.3 The p chart: Control Chart for Fraction Nonconforming with Constant Samples Sizes225

 6.3.1 The p Chart: Control Chart for Fraction Nonconforming with Variable Samples Sizes 231

 6.3.2 The np Chart: Control Chart for Number of Nonconforming Units 235

6.4 The c-Control chart - Control chart for nonconformities per sample 237

6.5 The U-Chart  242

Review Practice Problems  249

Chapter 7 - Phase II Control Charts for Detecting Small Shifts256

7.1 Introduction  256

7.2 Basic Concepts of CUSUM Control Chart257

7.3 Designing a CUSUM Control Chart  261

 7.3.1 Two-Sided CUSUM Control Chart Using Numerical Procedure 262

 7.3.2 The Fast-Initial Response (FIR) Feature for CUSUM Control Chart 271

 7.3.3 One-Sided CUSUM Control chart 276

 7.3.4 Combined Shewhart-CUSUM Control Chart   277

 7.3.5 CUSUM Control Chart for Controlling Process Variability  278


7.4 Moving Average Control Chart  279

7.5 Exponentially Weighted Moving Average Control Chart  284

Review Practice Problems292


Chapter 8 - Process and Measurement System Capability Analysis 298

8.1 Introduction 298

8.2 Development of Process Capability Indices300

8.3 Various Process Capability Indices 302

 8.3.1 Process Capability Index   302

 8.3.2 Process Capability Index 309

 8.3.3 Process Capability Index  314

 8.3.4 Process Capability Index  317

 8.3.5 Process Capability Index  318

8.3.5.1 Comparing   with Process Capability Indices   and 321

8.3.5.2 Certain Other Features of the Capability Index 323

 8.3.6 Process Performance Indices and 325

8.4 The Pre-control   326

 8.4.1 Global Perspective on Use of Pre-control (Understanding the Color- Coding  

   Scheme) 328

 8.4.2 The Mechanics of Pre-control 329

 8.4.3 The Statistical Basis for Pre-control 331

 8.4.4 Advantages and Disadvantages of Pre-control 333

8.4.4.1 Advantages of Pre-control 333

8.4.4.2 Disadvantages of Pre-control  333

8.5 Measurement System Capability Analysis 334

 8.5.1 Evaluating Measurement System Performance 336

 8.5.2 The Range Method337

 8.5.3 The ANOVA Method  344

 8.5.4 Graphical Representation of Gauge R&R Study 350

 8.5.5 Another Measurement Capability Index353

Review Practice Problems   354

Chapter 9 - ACCEPTANCE SAMPLING PLANS 363

9.1 Introduction363

9.2 The Intent of Acceptance of Sampling Plan   363

9.3 Sampling Inspection Versus 100 Percent Inspection 364

9.4 Classification of Sampling Plans 364

 9.4.1 Formation of Lots for Acceptance Sampling Plans 365

 9.4.2 The Operating Characteristic (OC) Curve   365

9.5 Acceptance Sampling by Attributes   371  

9.6 Single Sampling Plans for Attributes 375

9.7 Other Types of Sampling Plans for Attributes 376

 9.7.1 Double Sampling Plans for Attributes   376

 9.7.2 The OC Curve 377

 9.7.3 Multiple Sampling Plans 381

 9.7.4 Average Sample Number  381

 9.7.5 Sequential Sampling Plans 382

9.8 Sampling Standards and Plans 386

 9.8.1 ANSI/ASQ Z1.4-2003 387

 9.8.2 Levels of Inspection 389

 9.8.3 Types of Sampling   390

9.9 Dodge-Romig Tables 392

9.10 Acceptance Sampling Plans By variables   392

 9.10.1 ANSI/ASQ Z1.9-2003  394

 9.10.2 Variability Unknown - Standard Deviation Method 395

 9.10.3 Variability Unknown - Range Method  397

9.11 Continuous Sampling Plans 399

 9.11.1 Types of Continuous Sampling Plans 400

 9.11.2 Dodge’s Continuous Sampling Plans  400

 9.11.3 MIL-STD-1235B400

Review Practice Problems  401

Chapter 10 – CPMPUTER RESOURCES TO SUPPORT SQC 427

10.1 Introduction427

10.2 Using MINITAB

10.3 Using R

10.4 Using JMP

10.5 Using PYTHON

Supplemental Materials

What is included with this book?

The New copy of this book will include any supplemental materials advertised. Please check the title of the book to determine if it should include any access cards, study guides, lab manuals, CDs, etc.

The Used, Rental and eBook copies of this book are not guaranteed to include any supplemental materials. Typically, only the book itself is included. This is true even if the title states it includes any access cards, study guides, lab manuals, CDs, etc.

Rewards Program