did-you-know? rent-now

Amazon no longer offers textbook rentals. We do!

did-you-know? rent-now

Amazon no longer offers textbook rentals. We do!

We're the #1 textbook rental company. Let us show you why.

9780130083692

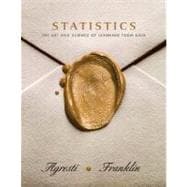
Statistics: The Art And Science of Learning from Data

by ;
  • ISBN13:

    9780130083692

  • ISBN10:

    0130083690

  • Edition: 2nd
  • Format: Hardcover w/CD
  • Copyright: 2009-01-01
  • Publisher: Prentice Hall
  • View Upgraded Edition

Note: Supplemental materials are not guaranteed with Rental or Used book purchases.

Purchase Benefits

  • Free Shipping Icon Free Shipping On Orders Over $35!
    Your order must be $35 or more to qualify for free economy shipping. Bulk sales, PO's, Marketplace items, eBooks and apparel do not qualify for this offer.
  • eCampus.com Logo Get Rewarded for Ordering Your Textbooks! Enroll Now
List Price: $137.33 Save up to $34.33
  • Buy Used
    $103.00
    Add to Cart Free Shipping Icon Free Shipping

    USUALLY SHIPS IN 2-4 BUSINESS DAYS

Supplemental Materials

What is included with this book?

Summary

For algebra-based Introductory Statistics Courses. The overarching goal of this text is to empower students to be statistical thinkers Alan Agresti and Chris Franklin have merged their research expertise, as well as their extensive real-world and teaching experience, to develop a new introductory statistics text that makes students statistically literate, while encouraging them to ask and answer interesting statistical questions. The authors have successfully crafted a text that takes the ideas that have turned statistics into a central science in modern life and makes them accessible and engaging to students without compromising necessary rigor. The varied and data-rich examples and exercises place heavy emphasis on thinking about and understanding statistical concepts. The applications are topical and current and successfully illustrate the relevance of statistics. The authors understand that most of the real-world data that students encounter outside the class room are categorical data. Unlike many texts at this level, Agresti/Franklin incorporates categorical data where appropriate and draws distinctions between theory and practical application of statistical ideas and methods. The text was written, from the ground up, to embrace and support the 6 recommendations of the ASA endorsed GAISE (Guidelines for Assessment for Instruction in Statistical Education) Report - http://www.amstat.org/education/gaise/GAISECollege.htm : Emphasize statistical literacy and develop statistical thinking. Use real data. Stress conceptual understanding rather than mere knowledge of procedures. Foster active learning in the classroom. Use technology for developing concepts and analyzing data. Use assessment to evaluate and improve student learning. Comes with a CD containing data sets, additional activities, and applets. The CD with the IE, furthermore, includes Instructor-to-Instructor videos which further detail, by chapter, the authors approach and provides suggestions on how to present concepts. These Instructor-to-Instructor videos are very complimentary to the IE chapter introductions.

Table of Contents

Preface x
Statistics: The Art and Science of Learning from Data
02(22)
How Can You Investigate Using Data?
04(5)
We Learn about Populations Using Samples
09(7)
What Role do Computers Play in Statistics?
16(8)
Chapter Summary
21(1)
Chapter Problems
21(3)
Exploring Data with Graphs and Numerical Summaries
24(64)
What Are the Types of Data?
26(4)
How Can We Describe Data Using Graphical Summaries?
30(18)
How Can We Describe the Center of Quantitative Data?
48(8)
How Can We Describe the Spread of Quantitative Data?
56(8)
How Can Measures of Position Describe Spread?
64(10)
How Are Descriptive Summaries Misused?
74(14)
Answers to Chapter Figure Questions
79(1)
Chapter Summary
80(1)
Chapter Problems
81(7)
Association: Contingency, Correlation, and Regression
88(58)
How Can We Explore the Association between Two Categorical Variables?
90(7)
How Can We Explore the Association between Two Quantitative Variables?
97(12)
How Can We Predict the Outcome of a Variable?
109(13)
What Are Some Cautions in Analyzing Associations?
122(24)
Answers to Chapter Figure Questions
138(1)
Chapter Summary
139(1)
Chapter Problems
139(7)
Gathering Data
146(46)
Should We Experiment or Should We Merely Observe?
148(7)
What Are Good Ways and Poor Ways to Sample?
155(12)
What Are Good Ways and Poor Ways to Experiment?
167(6)
What Are Other Ways to Perform Experimental and Observational Studies?
173(19)
Answers to Chapter Figure Questions
184(1)
Chapter Summary
184(1)
Chapter Problems
184(8)
Probability in Our Daily Lives
192(52)
How Can Probability Quantify Randomness?
194(7)
How Can We Find Probabilities?
201(13)
Conditional Probability: What's the Probability of A, Given B?
214(10)
Applying the Probability Rules
224(20)
Answers to Chapter Figure Questions
237(1)
Chapter Summary
237(1)
Chapter Problems
238(6)
Probability Distributions
244(70)
How Can We Summarize Possible Outcomes and Their Probabilities?
246(11)
How Can We Find Probabilities for Bell-Shaped Distributions?
257(11)
How Can We Find Probabilities When Each Observation Has Two Possible Outcomes
268(10)
How Likely Are the Possible Values of a Statistic? The Sampling Distribution
278(10)
How Close Are Sample Means to Population Means
288(9)
How Can We Make Inferences About a Population?
297(17)
Answers to Chapter Figure Questions
304(1)
Chapter Summary
304(1)
Chapter Problems
305(9)
Statistical Inference: Confidence Intervals
314(52)
What Are Point and Interval Estimates of Population Parameters?
316(6)
How Can We Construct a Confidence Interval to Estimate a Population Proportion?
322(11)
How Can We Construct a Confidence Interval to Estimate a Population Mean?
333(12)
How Do We Choose the Sample Size for a Study?
345(9)
How Do Computers Make New Estimation Methods Possible?
354(12)
Answers to Chapter Figure Questions
358(1)
Chapter Summary
358(1)
Chapter Problems
359(7)
Statistical Inference: Significance Tests About Hypotheses
366(58)
What Are the Steps for Performing a Significance Test?
368(4)
Significance Tests About Proportions
372(16)
Significance Tests About Means
388(12)
Decisions and Types of Errors in Significance Tests
400(4)
Limitations of Significance Tests
404(7)
How Likely Is a Type II Error (Not Rejecting H0, Even though It's False)?
411(13)
Answers to Chapter Figure Questions
417(1)
Chapter Summary
417(2)
Chapter Problems
419(5)
Comparing Two Groups
424(60)
Categorical Response: How Can We Compare Two Proportions?
427(12)
Quantitative Response: How Can We Compare Two Means?
439(12)
Other Ways of Comparing Means and Comparing Proportions
451(7)
How Can We Analyze Dependent Samples?
458(11)
How Can We Adjust for Effects of Other Variables?
469(15)
Answers to Chapter Figure Questions
475(1)
Chapter Summary
475(1)
Chapter Problems
476(8)
Analyzing the Association Between Categorical Variables
484(40)
What Is Independence and What Is Association?
486(4)
How Can We Test Whether Categorical Variables are Independent?
490(13)
How Strong Is the Association?
503(7)
How Can Residuals Reveal the Pattern of Association?
510(4)
What if the Sample Size Is Small? Fisher's Exact Test
514(10)
Answers to Chapter Figure Questions
518(1)
Chapter Summary
519(1)
Chapter Problems
519(5)
Analyzing Association Between Quantitative Variables: Regression Analysis
524(52)
How Can We ``Model'' How Two Variables Are Related?
526(8)
How Can We Describe Strength of Association?
534(12)
How Can We Make Inferences About the Association?
546(7)
What Do We Learn from How the Data Vary Around the Regression Line?
553(10)
Exponential Regression: A Model for Nonlinearity
563(13)
Answers to Chapter Figure Questions
568(1)
Chapter Summary
569(1)
Chapter Problems
570(6)
Multiple Regression
576(48)
How Can We Use Several Variables to Predict a Response?
578(5)
Extending the Correlation and R-Squared for Multiple Regression
583(5)
How Can We Use Multiple Regression to Make Inferences?
588(11)
Checking a Regression Model Using Residual Plots
599(5)
How Can Regression Include Categorical Predictors?
604(6)
How Can We Model a Categorical Response?
610(14)
Answers to Chapter Figure Questions
618(1)
Chapter Summary
619(1)
Chapter Problems
619(5)
Comparing Groups: Analysis of Variance Methods
624(42)
How Can We Compare Several Means?: One-Way ANOVA
626(10)
How Should We Follow Up an ANOVA F Test
636(9)
What if There Are Two Factors?: Two-Way ANOVA
645(21)
Answers to Chapter Figure Questions
659(1)
Chapter Summary
659(1)
Chapter Problems
660(6)
Nonparametric Statistics
666
How Can We Compare Two Groups by Ranking?
668(11)
Nonparametric Methods for Several Groups and for Matched Pairs
679
Answers to Chapter Figure Questions
689(1)
Chapter Summary
690(1)
Chapter Problems
690
Appendices
1(1)
Tables
1(6)
Selected Answers
7
Index 1(1)
Photo Credits 1

Supplemental Materials

What is included with this book?

The New copy of this book will include any supplemental materials advertised. Please check the title of the book to determine if it should include any access cards, study guides, lab manuals, CDs, etc.

The Used, Rental and eBook copies of this book are not guaranteed to include any supplemental materials. Typically, only the book itself is included. This is true even if the title states it includes any access cards, study guides, lab manuals, CDs, etc.

Rewards Program