did-you-know? rent-now

Rent More, Save More! Use code: ECRENTAL

did-you-know? rent-now

Rent More, Save More! Use code: ECRENTAL

5% off 1 book, 7% off 2 books, 10% off 3+ books

9780130466532

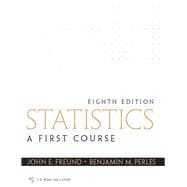
Statistics A First Course

by ;
  • ISBN13:

    9780130466532

  • ISBN10:

    0130466530

  • Edition: 8th
  • Format: Paperback
  • Copyright: 2003-08-11
  • Publisher: Pearson

Note: Supplemental materials are not guaranteed with Rental or Used book purchases.

Purchase Benefits

  • Free Shipping Icon Free Shipping On Orders Over $35!
    Your order must be $35 or more to qualify for free economy shipping. Bulk sales, PO's, Marketplace items, eBooks and apparel do not qualify for this offer.
  • eCampus.com Logo Get Rewarded for Ordering Your Textbooks! Enroll Now
  • Buyback Icon We Buy This Book Back!
    In-Store Credit: $4.20
    Check/Direct Deposit: $4.00
    PayPal: $4.00
List Price: $119.99 Save up to $48.00
  • Rent Book $71.99
    Add to Cart Free Shipping Icon Free Shipping

    TERM
    PRICE
    DUE
    USUALLY SHIPS IN 2-3 BUSINESS DAYS
    *This item is part of an exclusive publisher rental program and requires an additional convenience fee. This fee will be reflected in the shopping cart.

How To: Textbook Rental

Looking to rent a book? Rent Statistics A First Course [ISBN: 9780130466532] for the semester, quarter, and short term or search our site for other textbooks by Freund, John E., Emeritus; Perles, Benjamin M.. Renting a textbook can save you up to 90% from the cost of buying.

Summary

This book offers a straightforward, "nuts and bolts" , introduction to statistics. The explanations are clear and simple and minimize calculations where possible. A diverse range of applications and examples are presented to make the materials appealing to a wide range of learners.The Eighth Edition features new problems, more real data based examples and exercises, and fuller integration of technology.For individuals beginning a study of statistics.

Table of Contents

Introduction
Numerical Data and Categorical Data
Nominal, Ordinal, Interval, and Ratio Data
Sample Data and Populations
Biased Data
Statistics, Past and Present
The Study of Statistics
Statistics, What Lies Ahead
Summarizing Data: Listing and Grouping
Dot Diagrams
Stem-and-Leaf Displays
Frequency Distributions
Graphical Presentations
Summarizing Data: Statistical Descriptions
Measures of Location: The Mean
Measures of Location: The Weighted Mean
Measures of Location: The Median and Other Fractiles
Measures of Location: The Mode
Measures of Variation: The Range
Measures of Variation: The Standard Deviation
Some Applications of the Standard Deviation
The Description of Grouped Data
Some Further Descriptions
Technical Note Summations
Review: Chapters 1,2, & 3
Possibilities and Probabilities
Counting
Permutations
Combinations
Probability
Mathematical Expectation
A Decision Problem
Some Rules of Probability
The Sample Space
Events
Some Basic Rules of Probability
Probabilities and Odds
Addition Rules
Conditional Probability
Independent Events
Multiplication Rules
Bayes' Theorem
Review: Chapters 4 & 5
Probability Distributions
The Binomial Distribution
The Hypergeometric Distribution
The Poisson Distribution
The Multinomial Distribution
The Mean of a Probability Distribution
The Standard Deviation of a Probability Distribution
Chebyshev's Theorem
The Normal Distribution
Continuous Distributions
The Normal Distribution
Some Applications
The Normal Approximation to the Binomial Distribution
Sampling and Sampling Distributions
Random Sampling
Sampling Distributions
The Standard Error of the Mean
The Central Limit Theorem
Review: Chapters 6, 7, & 8
Problems of Estimation
The Estimation of Means
Confidence Intervals for Means
Confidence Intervals for Means (Small Samples)
Confidence Intervals for Standard Deviations
The Estimation of Proportions
Tests Concerning Means
Tests of Hypotheses
Significance Tests
Tests Concerning Means
Tests Concerning Means (Small Samples)
Differences Between Means
Differences Between Means (Small Samples)
Differences Between Means (Paired Data)
Differences Among k
Means
Analysis of Variance
Tests Based on Count Data
Tests Concerning Proportions
Tests Concerning Proportions (Large Samples)
Differences Between Proportions
Differences Among Proportions
Contingency Tables
Goodness of Fit
Review: Chapters 9, 10, & 11
Regression and Correlation
Curve Fitting
The Method of Least Squares
Regression Analysis
The Coefficient of Correlation
The Interpretation of r
A Significance Test for r
Nonparametric Tests
The One-Sample Sign Test
The Paired-Sample Sign Test
The Sign Test (Large Samples)
Rank Sums: The U
Test
Rank Sums: The U Test (Large Samples)
Rank Sums: The H
Test
Tests of Randomness: Runs
Tests of Randomness: Runs (Large Samples)
Tests of Randomness: Runs Above and Below the Median
Rank Correlation
Review: Chapters 12 & 13
TI-83 Tips
Bibliography
Statistical Tables
Answers to Odd-Numbered Exercises
Index
Table of Contents provided by Publisher. All Rights Reserved.

Supplemental Materials

What is included with this book?

The New copy of this book will include any supplemental materials advertised. Please check the title of the book to determine if it should include any access cards, study guides, lab manuals, CDs, etc.

The Used, Rental and eBook copies of this book are not guaranteed to include any supplemental materials. Typically, only the book itself is included. This is true even if the title states it includes any access cards, study guides, lab manuals, CDs, etc.

Excerpts

This book is intended primarily for use in a first course in statistics. There is a systematic academic approach inStatistics: A First Course,8th edition. Its emphasis is on instruction in meaningful, well-established statistical techniques. The future would-be medical doctor, business executive, scientist, teacher, or other professional specialist must comprehend and be skillful in the application of basic statistical tools and methodology. The student's knowledge of statistics is greatly enhanced by repeated exposure to statistical exercises. The book contains a wide selection of nearly 1,000 exercises, presented throughout the text. The book also offers a large number of detailed illustrations and examples, in each chapter, designed to provide guidance to readers.Important formulas, definitions, and rules are highlighted within colored boxes. The frequently used tables for normal andtdistributions are repeated on the inside back cover, and the inside front cover contains an indexed glossary of statistical symbols.As in previous editions, controversy has not been avoided. The reader is exposed to the weaknesses of statistical techniques, as well as their strengths. It is hoped that this honest approach will provide a stimulus as well as a challenge.For instructors who have used previous editions of this textbook, it should be noted that the problem sets have been extensively revised. Many additional real data-based problems have been added. Internal referencing within the problem sets has been minimized. Where necessary, pertinent data has been repeated to free students from the unproductive "busy work" of flipping back to previous problems. USE OF TECHNOLOGYThe book makes extensive use of technology such as the computer, graphing calculator, and MINITAB, but their importance should not be overstated. The entire text is built around the authors' goal of presenting statistics at a level that is appropriate and interesting for beginning students.In spite of their obvious value, computers and graphing calculators can safely be eliminated by readers of this textbook without loss of continuity.This edition uses, but does not require, MINITAB. MINITAB printouts, showing both output and session commands, are set off in boxes and are referenced in the examples. MINITAB users will be pleased by the new opportunity for students to purchase this textbook packaged with a CD-ROM containing the data files for this book.Although it is not required, this edition also uses the graphing calculator and acquaints the reader with its numerous benefits.Using Technology: The Graphing Calculatorboxes appear throughout the book. These boxes provide keystrokelevel instruction for using the TI-83 to find solutions to selected examples in the book.Appendix A,TI-83Tips, written by Dorothy Wakefield of the University of Connecticut and Kathleen McLaughlin of Manchester Community College, provides additional help in using the graphing calculator.Many problems are designed to be solved with the aid of a computer or a graphing calculator and are identified with a technology icon. OTHER FEATURESReviewsections are presented at two- or three-chapter intervals throughout the book. Five review sections reinforce connections outside the context of a particular section or chapter. Identified with a pale blue screen, they include A list ofAchievementsthat students should have mastered after studying the group of chapters; AChecklist of Key Termsannotated with specific page references; A cumulative section ofReview Exercisesthat tests concepts from the immediately preceding chapters.Representative problems within each exercise set are highlighted with a check to identify them asPractice Exercises.Fully worked out solutions to these exercises are presented at the end of each chapter

Rewards Program