rent-now

Rent More, Save More! Use code: ECRENTAL

5% off 1 book, 7% off 2 books, 10% off 3+ books

9780135428269

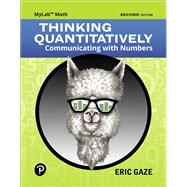
Thinking Quantitatively Communicating with Numbers MyLab Math with Guided Worksheets -- Title-Specific Access Card Package

by
  • ISBN13:

    9780135428269

  • ISBN10:

    0135428262

  • Edition: 2nd
  • Format: Package
  • Copyright: 2019-08-13
  • Publisher: Pearson

Note: Supplemental materials are not guaranteed with Rental or Used book purchases.

Purchase Benefits

List Price: $139.99 Save up to $19.97
  • Rent Book $120.02
    Add to Cart Free Shipping Icon Free Shipping

    TERM
    PRICE
    DUE
    USUALLY SHIPS IN 2-3 BUSINESS DAYS
    *This item is part of an exclusive publisher rental program and requires an additional convenience fee. This fee will be reflected in the shopping cart.

How To: Textbook Rental

Looking to rent a book? Rent Thinking Quantitatively Communicating with Numbers MyLab Math with Guided Worksheets -- Title-Specific Access Card Package [ISBN: 9780135428269] for the semester, quarter, and short term or search our site for other textbooks by Gaze, Eric. Renting a textbook can save you up to 90% from the cost of buying.

Summary

NOTE: Before purchasing, check with your instructor to ensure you select the correct ISBN. Several versions of the MyLab™ and Mastering™ platforms exist for each title, and registrations are not transferable. To register for and use MyLab or Mastering, you may also need a Course ID, which your instructor will provide.


Used books, rentals, and purchases made outside of Pearson

If purchasing or renting from companies other than Pearson, the access codes for the MyLab platform may not be included, may be incorrect, or may be previously redeemed. Check with the seller before completing your purchase.


For courses in Quantitative Literacy, Quantitative Reasoning, or Liberal Arts Math.

This product includes MyLab Math.


Empowerment through numbers 

It’s essential for students to understand, communicate, and make decisions with data they will encounter every day in their personal, civic, and business lives. Understanding the numbers behind real-life topics enables them to evaluate information and make confident choices.


Thinking Quantitatively, 2nd Edition empowers students to develop the critical-thinking and math skills they need to become informed and numerically literate citizens. This fully digital solution provides a seamless learning experience that includes Gaze’s text content, extensively revised Guided Worksheets with real-world examples, and auto-graded Excel® problems with immediate feedback. Students will be able to put their learning to practice immediately. 


With new auto-graded Excel homework, Thinking Quantitatively also supports students in using Excel to directly analyze and interpret data. Additionally, students are now able to visualize data through the use of StatCrunch® applets throughout the eText.


Personalize learning with MyLab Math 

By combining trusted author content with digital tools and a flexible platform, MyLab Math personalizes the learning experience and improves results for each student. 


0135428262 / 9780135428269  THINKING QUANTITATIVELY: COMMUNICATING WITH NUMBERS MYLAB MATH WITH GUIDED WORKSHEETS -- TITLE-SPECIFIC ACCESS CARD PACKAGE, 2/e 

Author Biography

Eric Gaze is a well-known leader in the quantitative reasoning community. After experiences teaching a liberal arts math course and an Excel course early in his career, Eric began to think about giving students a truly meaningful experience in math. He also came to see that spreadsheets were a powerful way to engage in real-world problem solving while learning mathematical concepts. Excited to discover a group of like-minded educators talking about “Quantitative Reasoning,” Eric began seriously working out a framework for a new course based around both proportional reasoning and Excel.


Eric directs the Quantitative Reasoning (QR) program at Bowdoin College, is Chair of the Center for Learning and Teaching, and is a Lecturer in the Mathematics Department.  He is the current President of the National Numeracy Network (NNN 2013 — ), and a past chair of SIGMAA-QL (2010-12).  He writes a column, Ratiocination, for the NNN website. Eric has given talks and led workshops on the topics of QR Across the Curriculum, Creating a QR Entry Point Course, Writing with Numbers, QR Assessment, and Running a QR Program; he has served on review teams of QR programs. 


Eric is the Principal Investigator for a NSF TUES Type I grant (2012-14), Quantitative Literacy and Reasoning Assessment (QLRA) DUE 1140562. This collaborative project builds on Bowdoin College's QR instrument which is used for advising purposes and is available to interested schools. Prior to coming to Bowdoin, Eric led the development of a Masters in Numeracy program for K-12 teachers at Alfred University as an Associate Professor of Mathematics and Education.

Table of Contents

Spreadsheet Basics

A.1 Introduction to Spreadsheets

A.2 Built-in Functions

A.3 Charts


Chapter 1: An Excel-lent Approach to Relationships

1.1 Functions

1.2 Analytic Representations: Equations

1.3 Numerical and Graphical Representations: Tables and Charts

1.4 Spotlight on Statistics


Chapter 2: Ratios and Proportions

2.1 Ratios and Proportions

2.2 Weighted Averages

2.3 Proportionality

2.4 Financial Literacy

2.5 Spotlight on Statistics


Chapter 3: Units, Conversions, Scales, and Rates

3.1 Units and Conversions

3.2 Scales

3.3 Rates

3.4 Dosages and Concentrations

3.5 Spotlight on Statistics


Chapter 4: Percentages

4.1 Percentages

4.2 Part-to-Whole Ratios

4.3 Percent Change and Difference

4.4 Data Tables with Percentages

4.5 Spotlight on Statistics


Chapter 5: Linear Functions

5.1 Proportionality

5.2 Slopes and y-intercepts

5.3 Linear Equations

5.4 Spotlight on Statistics


Chapter 6: Exponential Functions

6.1 Constant Percent Change

6.2 Exponential Functions

6.3 Average Percent Change

6.4 Spotlight on Statistics


Chapter 7: Logical Arithmetic

7.1 Logarithms

7.2 Doubling Times and Half-Lives

7.3 Annual Percentage Yield

7.4 Continuous Growth and Euler’s Number: e

7.5 Spotlight on Statistics


Chapter 8: Curve Fitting and Correlation

8.1 Correlation, Causation, and Confounding Factors

8.2 Best-Fit, Least-Squares, and Regression Lines

8.3 Correlation Coefficient and Coefficient of Linear Determination

8.4 Spotlight on Statistics


Chapter 9: Financial Health

9.1 Retirement

9.2 Securities: Cash, Stocks, Mutual Funds, and Bonds

9.3 401(k) Plans

9.4 Built-in Financial Functions

9.5 Loans


Chapter 10: Logically!

10.1 Logical Statements

10.2 Excel’s IF Function

10.3 VLOOKUP

10.4 Random Simulations


Chapter 11: Chance, Risk, and Likelihood

11.1 Risk and Decision Making

11.2 Probability and Counting

11.3 Conditional Probabilities

11.4 Unions and Complements

11.5 Spotlight on Statistics


NEW - Chapter 12: Statistically Speaking

12.1 Data Distributions: Frequency and Probability

12.2 Binomial and Normal Distributions

12.3 Sampling Distributions and Confidence Intervals

12.4 Hypothesis Testing


NEW - Chapter 13: Modeling the Real World

13.1 Modeling Basics

13.2 Rate (Population) Models

13.3 Stochastic (Random) Models

13.4 Linear Programming (Optimization) Models

13.5 Spotlight on Statistics


Supplemental Materials

What is included with this book?

The New copy of this book will include any supplemental materials advertised. Please check the title of the book to determine if it should include any access cards, study guides, lab manuals, CDs, etc.

The Used, Rental and eBook copies of this book are not guaranteed to include any supplemental materials. Typically, only the book itself is included. This is true even if the title states it includes any access cards, study guides, lab manuals, CDs, etc.

Rewards Program