did-you-know? rent-now

Amazon no longer offers textbook rentals. We do!

did-you-know? rent-now

Amazon no longer offers textbook rentals. We do!

We're the #1 textbook rental company. Let us show you why.

9780197522431

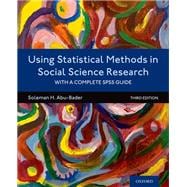
Using Statistical Methods in Social Science Research With a Complete SPSS Guide

by
  • ISBN13:

    9780197522431

  • ISBN10:

    0197522432

  • Edition: 3rd
  • Format: Paperback
  • Copyright: 2021-02-12
  • Publisher: Oxford University Press

Note: Supplemental materials are not guaranteed with Rental or Used book purchases.

Purchase Benefits

  • Free Shipping Icon Free Shipping On Orders Over $35!
    Your order must be $35 or more to qualify for free economy shipping. Bulk sales, PO's, Marketplace items, eBooks and apparel do not qualify for this offer.
  • eCampus.com Logo Get Rewarded for Ordering Your Textbooks! Enroll Now
  • Buyback Icon We Buy This Book Back!
    In-Store Credit: $15.75
    Check/Direct Deposit: $15.00
    PayPal: $15.00
List Price: $74.65 Save up to $32.10
  • Rent Book $42.55
    Add to Cart Free Shipping Icon Free Shipping

    TERM
    PRICE
    DUE
    USUALLY SHIPS IN 3-5 BUSINESS DAYS
    *This item is part of an exclusive publisher rental program and requires an additional convenience fee. This fee will be reflected in the shopping cart.

Supplemental Materials

What is included with this book?

Summary

Using Statistical Methods in Social Science Research, Third Edition is the user-friendly text every student needs for analyzing and making sense of quantitative data. With over 20 years of experience teaching statistics, Soleman H. Abu-Bader provides an accessible, step-by-step description of the process needed to organize data, choose a test or statistical technique, analyze, interpret, and report research findings.

The book begins with an overview of research and statistical terms, followed by an explanation of basic descriptive statistics. It then focuses on the purpose, rationale, and assumptions made by each test, such as Pearson's correlation, student's t-tests, analysis of variances, and simple linear regression, among others. The book also provides a wealth of research examples that clearly display the applicability and function of these tests in real-world practice. In a separate appendix, the author provides a step-by-step process for calculating each test for those who still like to understand the mathematical formulas behind these processes.
Author Biography


Soleman Abu-Bader, MSW, PHD, is Professor and Chair of Research Sequence at the School of Social Work at Howard University. He is the author of Advanced & Multivariate Statistical Methods for Social Science Research as well as several research articles on organizational behavior and elderly, physical and mental health. He is the founder of the first graduate social work program in Qatar.

Table of Contents


Preface
List of Figures
List of Tables
List of SPSS Screen Captures

Chapter 1: Overview of Mathematical and Research Methodological Terms
Learning Objectives
Introduction
Basic Mathematical Concepts
Variable and Constants
Levels of Measurement
Research Hypotheses
Psychometric Properties of an Instrument
Population and Sample
Descriptive and Inferential Statistics
Types of Relationships between Two Variables
Summary
Key Terms
Practical Exercises

Chapter 2: Working with SPSS
Learning Objectives
Introduction
About the SPSS Program
Creating an Instrumentation Codebook
Practical Example
Starting the SPSS Program
Summary
Key Terms
Practical Exercises

Chapter 3: Data Organization and Summary: Frequency Tables and Graphs
Learning Objectives
Introduction
Frequency Distributions
Graphic Presentations of Data
Summary
Key Terms
Practical Exercises

Chapter 4: Descriptive Statistics: Measures of Central Tendency, Variability, and Percentiles
Learning Objectives
Introduction
Measures of Central Tendency
Measures of Variability
What Measures to Report
Percentile and Percentile Ranks
Box-and-Whisker Plot
Summary
Key Terms
Practical Exercises

Chapter 5: Distributions, Data Transformations, and Standard Z Scores
Learning Objectives
Introduction
Normality of Distributions
Standard Scores (z Scores)
Summary
Key Terms
Practical Exercises

Chapter 6: Hypothesis Testing and Selecting a Statistical Test
Learning Objectives
Introduction
Research Hypotheses
Errors in Hypothesis Testing
Confidence Interval
Selecting a Statistical Test
Summary
Key Terms
Practical Exercises

Chapter 7: Bivariate Correlations
Learning Objectives
Introduction
Correlation
Scatterplot
Correlation and Causality
Correlational Tests
Assumptions
Spearman's Rank Correlation Coefficient
Partial Correlation Test
Practical Examples
Summary
Key Terms
Practical Exercises

Chapter 8: Difference between Two Group Means: The One-Sample Case and Two-Sample Case t-Tests
Learning Objectives
Introduction
Student's t-Tests
One-Sample Case t-Test
Two-Sample Case t-Test
Mann-Whitney U Test
Practical Examples
Summary
Key Terms
Practical Exercises

Chapter 9: Dependent t-Test: Two-Paired Observations
Learning Objectives
Introduction
Dependent t-Test
Wilcoxon Signed Ranks Test
Practical Examples
Summary
Key Terms
Practical Exercises

Chapter 10: K Group Comparisons: One-Way Analysis of Variance and Covariance
Learning Objectives
Introduction
Why Not Use the Independent t-Test?
Analysis of Variance: An Overview
One-Way ANOVA
One-Way ANCOVA
Sources of Variations in ANOVA and ANCOVA
Assumptions of ANOVA and ANCOVA
Kruskal-Wallis H Test
Post Hoc Tests
Practical Examples
Summary
Key Terms
Practical Exercises

Chapter 11: Chi-Square Goodness-of-Fit Test and Test of Association
Learning Objectives
Introduction
Chi-Square Test
Chi-Square Goodness-of-Fit Test
Chi-Square Test of Association
Contingency Table
Assumptions of Chi-Square Tests
Fisher's Exact Test
Measures of Association
Practical Examples
Summary
Key Terms
Practical Exercises

Chapter 12: Simple Linear Regression
Learning Objectives
Introduction
Simple Linear Regression
Regression Equations and Scatterplot
Regression Coefficients
Confidence Interval
Assumptions
Practical Example
Summary
Key Terms
Practical Exercises

Appendix A: SPSS Data Files
Data File 1: Experimental Design (N = 60)
Data File 2: Immigrants (N = 40)
Data File 3: Job Satisfaction (N = 218)
Data File 4: Mental Health (N = 155)
Data File 5: Refugees (N = 230)
Data File 6: Reliability Analysis (N = 110)
Data File 7: Senior Citizens (N = 90)
Data File 8: Well-Being (N = 182)

Appendix B: Hand Calculations
B.1. Correlational Tests
B.2. One-Sample Case and Two-Sample Case T Tests
B.3. Student's T Test-Two-Paired Observations
B.4. One-Way Analysis of Variance and Covariance
B.5. Chi-Square Tests
B.6. Simple Linear Regression

Appendix C: Critical Values
Table C.1. Z Scores
Table C.2. Pearson's Correlation Critical Values
Table C.3. Spearman's Correlation Critical Values
Table C.4. T Distribution Critical Values
Table C.5. Wilcoxon Signed Ranks Test Critical Values
Table C.6. F Distribution Critical Values
Table C.7. Mann-Whitney U Test Critical Values
Table C.8. Tukey HSD Q Test Critical Values
Table C.9. Chi-Square Critical Values

References
Index

Supplemental Materials

What is included with this book?

The New copy of this book will include any supplemental materials advertised. Please check the title of the book to determine if it should include any access cards, study guides, lab manuals, CDs, etc.

The Used, Rental and eBook copies of this book are not guaranteed to include any supplemental materials. Typically, only the book itself is included. This is true even if the title states it includes any access cards, study guides, lab manuals, CDs, etc.

Rewards Program