did-you-know? rent-now

Amazon no longer offers textbook rentals. We do!

did-you-know? rent-now

Amazon no longer offers textbook rentals. We do!

We're the #1 textbook rental company. Let us show you why.

9781119829836

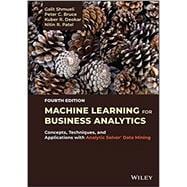
Machine Learning for Business Analytics Concepts, Techniques, and Applications with Analytic Solver Data Mining

by ; ; ;
  • ISBN13:

    9781119829836

  • ISBN10:

    1119829836

  • Edition: 4th
  • Format: Hardcover
  • Copyright: 2023-03-28
  • Publisher: Wiley

Note: Supplemental materials are not guaranteed with Rental or Used book purchases.

Purchase Benefits

List Price: $145.33 Save up to $96.59
  • Rent Book $48.74
    Add to Cart Free Shipping Icon Free Shipping

    TERM
    PRICE
    DUE
    IN STOCK USUALLY SHIPS WITHIN 24-48 HOURS.
    *This item is part of an exclusive publisher rental program and requires an additional convenience fee. This fee will be reflected in the shopping cart.

Supplemental Materials

What is included with this book?

Summary

Machine learning —also known as data mining or predictive analytics— is a fundamental part of data science. It is used by organizations in a wide variety of arenas to turn raw data into actionable information.

Machine Learning for Business Analytics: Concepts, Techniques, and Applications in Analytic Solver Data Mining provides a comprehensive introduction and an overview of this methodology. The fourth edition of this best-selling textbook covers both statistical and machine learning algorithms for prediction, classification, visualization, dimension reduction, rule mining, recommendations, clustering, text mining, experimentation, time series forecasting and network analytics. Along with hands-on exercises and real-life case studies, it also discusses managerial and ethical issues for responsible use of machine learning techniques.

This fourth edition of Machine Learning for Business Analytics also includes:

  • An expanded chapter focused on discussion of deep learning techniques
  • A new chapter on experimental feedback techniques including A/B testing, uplift modeling, and reinforcement learning
  • A new chapter on responsible data science
  • Updates and new material based on feedback from instructors teaching MBA, Masters in Business Analytics and related programs, undergraduate, diploma and executive courses, and from their students
  • A full chapter devoted to relevant case studies with more than a dozen cases demonstrating applications for the machine learning techniques
  • End-of-chapter exercises that help readers gauge and expand their comprehension and competency of the material presented
  • A companion website with more than two dozen data sets, and instructor materials including exercise solutions, slides, and case solutions

This textbook is an ideal resource for upper-level undergraduate and graduate level courses in data science, predictive analytics, and business analytics. It is also an excellent reference for analysts, researchers, and data science practitioners working with quantitative data in management, finance, marketing, operations management, information systems, computer science, and information technology.
Author Biography

Galit Shmueli, PhD, is Distinguished Professor and Institute Director at National Tsing Hua University’s Institute of Service Science. She has designed and instructed business analytics courses since 2004 at University of Maryland, Statistics.com, The Indian School of Business, and National Tsing Hua University, Taiwan.

Peter C. Bruce, is Founder of the Institute for Statistics Education at Statistics.com, and Chief Learning Officer at Elder Research, Inc.

Kuber Deokar is the Lead Instructional Operations Supervisor in Data Science at UpThink Experts, India. He is also a Faculty member at Statistics.com.

Nitin R. Patel, PhD, is cofounder and lead researcher at Cytel Inc. He was also a co-founder of Tata Consultancy Services. A Fellow of the American Statistical Association, Dr. Patel has served as a visiting professor at the Massachusetts Institute of Technology and at Harvard University. He is a Fellow of the Computer Society of India and was a professor at the Indian Institute of Management, Ahmedabad, for 15 years.

Table of Contents

Foreword xix

Preface to the Fourth Edition xxi

Acknowledgments xxv

PART I PRELIMINARIES

CHAPTER 1 Introduction 3

1.1 What Is Business Analytics? . . . . . . . . . . . . . . . . . . . . . . . . . . . 3

1.2 What Is Machine Learning? . . . . . . . . . . . . . . . . . . . . . . . . . . . 5

1.3 Machine Learning, AI, and Related Terms . . . . . . . . . . . . . . . . . . . . 5

1.4 Big Data . . . . . . . . . . . . . . . . . . . . . . . . . . . . . . . . . . . . . 7

1.5 Data Science . . . . . . . . . . . . . . . . . . . . . . . . . . . . . . . . . . 8

1.6 Why Are There So Many Different Methods? . . . . . . . . . . . . . . . . . . . 9

1.7 Terminology and Notation . . . . . . . . . . . . . . . . . . . . . . . . . . . . 9

1.8 Road Maps to This Book . . . . . . . . . . . . . . . . . . . . . . . . . . . . . 11

Order of Topics . . . . . . . . . . . . . . . . . . . . . . . . . . . . . . . . . 12

CHAPTER 2 Overview of the Machine Learning Process 15

2.1 Introduction . . . . . . . . . . . . . . . . . . . . . . . . . . . . . . . . . . . 15

2.2 Core Ideas in Machine Learning . . . . . . . . . . . . . . . . . . . . . . . . . 16

Classification . . . . . . . . . . . . . . . . . . . . . . . . . . . . . . . . . . 16

Prediction . . . . . . . . . . . . . . . . . . . . . . . . . . . . . . . . . . . . 16

Association Rules and Recommendation Systems . . . . . . . . . . . . . . . . . 16

Predictive Analytics . . . . . . . . . . . . . . . . . . . . . . . . . . . . . . . 17

Data Reduction and Dimension Reduction . . . . . . . . . . . . . . . . . . . . 17

Data Exploration and Visualization . . . . . . . . . . . . . . . . . . . . . . . . 17

Supervised and Unsupervised Learning . . . . . . . . . . . . . . . . . . . . . . 18

2.3 The Steps in a Machine Learning Project . . . . . . . . . . . . . . . . . . . . . 19

2.4 Preliminary Steps . . . . . . . . . . . . . . . . . . . . . . . . . . . . . . . . 21

Organization of Data . . . . . . . . . . . . . . . . . . . . . . . . . . . . . . 21

vii

viii CONTENTS

Sampling from a Database . . . . . . . . . . . . . . . . . . . . . . . . . . . . 21

Oversampling Rare Events in Classification Tasks . . . . . . . . . . . . . . . . . 22

Preprocessing and Cleaning the Data . . . . . . . . . . . . . . . . . . . . . . . 22

2.5 Predictive Power and Overfitting . . . . . . . . . . . . . . . . . . . . . . . . . 27

Creation and Use of Data Partitions . . . . . . . . . . . . . . . . . . . . . . . 27

Overfitting . . . . . . . . . . . . . . . . . . . . . . . . . . . . . . . . . . . 30

2.6 Building a Predictive Model with ASDM . . . . . . . . . . . . . . . . . . . . . 32

Predicting Home Values in the West Roxbury Neighborhood . . . . . . . . . . . 32

Modeling Process . . . . . . . . . . . . . . . . . . . . . . . . . . . . . . . . 34

Machine Learning Workflow . . . . . . . . . . . . . . . . . . . . . . . . . . . 41

2.7 Using Excel for Machine Learning . . . . . . . . . . . . . . . . . . . . . . . . 43

2.8 Automating Machine Learning Solutions . . . . . . . . . . . . . . . . . . . . . 43

Predicting Power Generator Failure . . . . . . . . . . . . . . . . . . . . . . . . 45

Uber’s Michelangelo . . . . . . . . . . . . . . . . . . . . . . . . . . . . . . . 47

2.9 Ethical Practice in Machine Learning . . . . . . . . . . . . . . . . . . . . . . . 49

Machine Learning Software: The State of the Market (by Herb Edelstein) . . . . . 49

Problems . . . . . . . . . . . . . . . . . . . . . . . . . . . . . . . . . . . . . . . . 54

PART II DATA EXPLORATION AND DIMENSION REDUCTION

CHAPTER 3 Data Visualization 59

3.1 Uses of Data Visualization . . . . . . . . . . . . . . . . . . . . . . . . . . . . 59

3.2 Data Examples . . . . . . . . . . . . . . . . . . . . . . . . . . . . . . . . . . 61

Example 1: Boston Housing Data . . . . . . . . . . . . . . . . . . . . . . . . 61

Example 2: Ridership on Amtrak Trains . . . . . . . . . . . . . . . . . . . . . . 62

3.3 Basic Charts: Bar Charts, Line Charts, and Scatter Plots . . . . . . . . . . . . . 62

Distribution Plots . . . . . . . . . . . . . . . . . . . . . . . . . . . . . . . . 64

Heatmaps: Visualizing Correlations and Missing Values . . . . . . . . . . . . . . 67

3.4 Multidimensional Visualization . . . . . . . . . . . . . . . . . . . . . . . . . . 68

Adding Variables . . . . . . . . . . . . . . . . . . . . . . . . . . . . . . . . . 69

Manipulations: Rescaling, Aggregation and Hierarchies, Zooming, Filtering . . . . 71

Reference: Trend Line and Labels . . . . . . . . . . . . . . . . . . . . . . . . 74

Scaling up to Large Datasets . . . . . . . . . . . . . . . . . . . . . . . . . . . 75

Multivariate Plot . . . . . . . . . . . . . . . . . . . . . . . . . . . . . . . . . 76

Interactive Visualization . . . . . . . . . . . . . . . . . . . . . . . . . . . . . 78

3.5 Specialized Visualizations . . . . . . . . . . . . . . . . . . . . . . . . . . . . 81

Visualizing Networked Data . . . . . . . . . . . . . . . . . . . . . . . . . . . 81

Visualizing Hierarchical Data: Treemaps . . . . . . . . . . . . . . . . . . . . . 82

Visualizing Geographical Data: Map Charts . . . . . . . . . . . . . . . . . . . . 84

3.6 Summary: Major Visualizations and Operations . . . . . . . . . . . . . . . . . . 86

Prediction . . . . . . . . . . . . . . . . . . . . . . . . . . . . . . . . . . . . 86

Classification . . . . . . . . . . . . . . . . . . . . . . . . . . . . . . . . . . 86

Time Series Forecasting . . . . . . . . . . . . . . . . . . . . . . . . . . . . . 86

Unsupervised Learning . . . . . . . . . . . . . . . . . . . . . . . . . . . . . . 87

Problems . . . . . . . . . . . . . . . . . . . . . . . . . . . . . . . . . . . . . . . . 88

CONTENTS ix

CHAPTER 4 Dimension Reduction 91

4.1 Introduction . . . . . . . . . . . . . . . . . . . . . . . . . . . . . . . . . . . 91

4.2 Curse of Dimensionality . . . . . . . . . . . . . . . . . . . . . . . . . . . . . 92

4.3 Practical Considerations . . . . . . . . . . . . . . . . . . . . . . . . . . . . . 92

Example 1: House Prices in Boston . . . . . . . . . . . . . . . . . . . . . . . 93

4.4 Data Summaries . . . . . . . . . . . . . . . . . . . . . . . . . . . . . . . . . 94

4.5 Correlation Analysis . . . . . . . . . . . . . . . . . . . . . . . . . . . . . . . 96

4.6 Reducing the Number of Categories in Categorical Variables . . . . . . . . . . . 97

4.7 Converting a Categorical Variable to a Numerical Variable . . . . . . . . . . . . 98

4.8 Principal Component Analysis . . . . . . . . . . . . . . . . . . . . . . . . . . 99

Example 2: Breakfast Cereals . . . . . . . . . . . . . . . . . . . . . . . . . . 99

Principal Components . . . . . . . . . . . . . . . . . . . . . . . . . . . . . . 103

Normalizing the Data . . . . . . . . . . . . . . . . . . . . . . . . . . . . . . 105

Using Principal Components for Classification and Prediction . . . . . . . . . . . 107

4.9 Dimension Reduction Using Regression Models . . . . . . . . . . . . . . . . . . 109

4.10 Dimension Reduction Using Classification and Regression Trees . . . . . . . . . . 110

Problems . . . . . . . . . . . . . . . . . . . . . . . . . . . . . . . . . . . . . . . . 111

PART III PERFORMANCE EVALUATION

CHAPTER 5 Evaluating Predictive Performance 115

5.1 Introduction . . . . . . . . . . . . . . . . . . . . . . . . . . . . . . . . . . . 115

5.2 Evaluating Predictive Performance . . . . . . . . . . . . . . . . . . . . . . . . 116

Benchmark: The Average . . . . . . . . . . . . . . . . . . . . . . . . . . . . . 117

Prediction Accuracy Measures . . . . . . . . . . . . . . . . . . . . . . . . . . 117

5.3 Judging Classifier Performance . . . . . . . . . . . . . . . . . . . . . . . . . . 121

Benchmark: The Naive Rule . . . . . . . . . . . . . . . . . . . . . . . . . . . 121

Class Separation . . . . . . . . . . . . . . . . . . . . . . . . . . . . . . . . . 121

The Classification Matrix . . . . . . . . . . . . . . . . . . . . . . . . . . . . . 122

Using the Validation Data . . . . . . . . . . . . . . . . . . . . . . . . . . . . 123

Accuracy Measures . . . . . . . . . . . . . . . . . . . . . . . . . . . . . . . . 123

Cutoff for Classification . . . . . . . . . . . . . . . . . . . . . . . . . . . . . 124

Performance in Unequal Importance of Classes . . . . . . . . . . . . . . . . . . 128

Asymmetric Misclassification Costs . . . . . . . . . . . . . . . . . . . . . . . . 131

5.4 Judging Ranking Performance . . . . . . . . . . . . . . . . . . . . . . . . . . 134

5.5 Oversampling . . . . . . . . . . . . . . . . . . . . . . . . . . . . . . . . . . 139

Problems . . . . . . . . . . . . . . . . . . . . . . . . . . . . . . . . . . . . . . . . 145

PART IV PREDICTION AND CLASSIFICATION METHODS

CHAPTER 6 Multiple Linear Regression 151

6.1 Introduction . . . . . . . . . . . . . . . . . . . . . . . . . . . . . . . . . . . 151

6.2 Explanatory vs. Predictive Modeling . . . . . . . . . . . . . . . . . . . . . . . 152

x CONTENTS

6.3 Estimating the Regression Equation and Prediction . . . . . . . . . . . . . . . . 154

Example: Predicting the Price of Used Toyota Corolla Cars . . . . . . . . . . . . 155

6.4 Variable Selection in Linear Regression . . . . . . . . . . . . . . . . . . . . . 158

Reducing the Number of Predictors . . . . . . . . . . . . . . . . . . . . . . . 158

Problems . . . . . . . . . . . . . . . . . . . . . . . . . . . . . . . . . . . . . . . . 165

CHAPTER 7 k-Nearest-Neighbors (k-NN) 169

7.1 The k-NN Classifier (categorical outcome) . . . . . . . . . . . . . . . . . . . . 169

Determining Neighbors . . . . . . . . . . . . . . . . . . . . . . . . . . . . . 170

Classification Rule . . . . . . . . . . . . . . . . . . . . . . . . . . . . . . . . 170

Example: Riding Mowers . . . . . . . . . . . . . . . . . . . . . . . . . . . . . 171

Choosing k . . . . . . . . . . . . . . . . . . . . . . . . . . . . . . . . . . . 172

Setting the Cutoff Value . . . . . . . . . . . . . . . . . . . . . . . . . . . . . 173

k-NN with More Than Two Classes . . . . . . . . . . . . . . . . . . . . . . . . 174

Converting Categorical Variables to Binary Dummies . . . . . . . . . . . . . . . 174

7.2 k-NN for a Numerical Response . . . . . . . . . . . . . . . . . . . . . . . . . 175

7.3 Machine Learning Workflow . . . . . . . . . . . . . . . . . . . . . . . . . . . 175

7.4 Advantages and Shortcomings of k-NN Algorithms . . . . . . . . . . . . . . . . 175

Problems . . . . . . . . . . . . . . . . . . . . . . . . . . . . . . . . . . . . . . . . 179

CHAPTER 8 The Naive Bayes Classifier 181

8.1 Introduction . . . . . . . . . . . . . . . . . . . . . . . . . . . . . . . . . . . 181

Example 1: Predicting Fraudulent Financial Reporting . . . . . . . . . . . . . . 182

8.2 Applying the Full (Exact) Bayesian Classifier . . . . . . . . . . . . . . . . . . . 183

Using the “Assign to the Most Probable Class” Method . . . . . . . . . . . . . . 183

Using the Cutoff Probability Method . . . . . . . . . . . . . . . . . . . . . . . 184

Practical Difficulty with the Complete (Exact) Bayes Procedure . . . . . . . . . . 184

8.3 Solution: Naive Bayes . . . . . . . . . . . . . . . . . . . . . . . . . . . . . . 185

8.4 Advantages and Shortcomings of the Naive Bayes Classifier . . . . . . . . . . . 193

Problems . . . . . . . . . . . . . . . . . . . . . . . . . . . . . . . . . . . . . . . . 195

CHAPTER 9 Classification and Regression Trees 197

9.1 Introduction . . . . . . . . . . . . . . . . . . . . . . . . . . . . . . . . . . . 197

Tree Structure . . . . . . . . . . . . . . . . . . . . . . . . . . . . . . . . . . 199

Decision Rules . . . . . . . . . . . . . . . . . . . . . . . . . . . . . . . . . . 199

9.2 Classification Trees . . . . . . . . . . . . . . . . . . . . . . . . . . . . . . . 200

Example 1: Riding Mowers . . . . . . . . . . . . . . . . . . . . . . . . . . . . 200

Measures of Impurity . . . . . . . . . . . . . . . . . . . . . . . . . . . . . . 203

9.3 Evaluating the Performance of a Classification Tree . . . . . . . . . . . . . . . . 206

Example 2: Acceptance of Personal Loan . . . . . . . . . . . . . . . . . . . . . 207

9.4 Avoiding Overfitting . . . . . . . . . . . . . . . . . . . . . . . . . . . . . . . 211

Stopping Tree Growth: CHAID . . . . . . . . . . . . . . . . . . . . . . . . . . 211

Pruning the Tree . . . . . . . . . . . . . . . . . . . . . . . . . . . . . . . . . 212

CONTENTS xi

9.5 Classification Rules from Trees . . . . . . . . . . . . . . . . . . . . . . . . . . 216

9.6 Classification Trees for More Than Two Classes . . . . . . . . . . . . . . . . . . 217

9.7 Regression Trees . . . . . . . . . . . . . . . . . . . . . . . . . . . . . . . . . 217

Prediction . . . . . . . . . . . . . . . . . . . . . . . . . . . . . . . . . . . . 218

Measuring Impurity . . . . . . . . . . . . . . . . . . . . . . . . . . . . . . . 218

Evaluating Performance . . . . . . . . . . . . . . . . . . . . . . . . . . . . . 220

9.8 Advantages and Weaknesses of Single Trees . . . . . . . . . . . . . . . . . . . 220

9.9 Improving Prediction: Random Forests and Boosted Trees . . . . . . . . . . . . 222

Random Forests . . . . . . . . . . . . . . . . . . . . . . . . . . . . . . . . . 222

Boosted Trees . . . . . . . . . . . . . . . . . . . . . . . . . . . . . . . . . . 222

Problems . . . . . . . . . . . . . . . . . . . . . . . . . . . . . . . . . . . . . . . . 225

CHAPTER 10 Logistic Regression 229

10.1 Introduction . . . . . . . . . . . . . . . . . . . . . . . . . . . . . . . . . . . 229

10.2 The Logistic Regression Model . . . . . . . . . . . . . . . . . . . . . . . . . . 231

Example: Acceptance of Personal Loan . . . . . . . . . . . . . . . . . . . . . . 232

Model with a Single Predictor . . . . . . . . . . . . . . . . . . . . . . . . . . 233

Estimating the Logistic Model from Data . . . . . . . . . . . . . . . . . . . . . 234

Interpreting Results in Terms of Odds . . . . . . . . . . . . . . . . . . . . . . 238

Evaluating Classification Performance . . . . . . . . . . . . . . . . . . . . . . 239

Variable Selection . . . . . . . . . . . . . . . . . . . . . . . . . . . . . . . . 241

10.3 Example of Complete Analysis: Predicting Delayed Flights . . . . . . . . . . . . 242

Data Visualization . . . . . . . . . . . . . . . . . . . . . . . . . . . . . . . . 243

Data Preprocessing . . . . . . . . . . . . . . . . . . . . . . . . . . . . . . . 244

Model Fitting and Estimation . . . . . . . . . . . . . . . . . . . . . . . . . . 245

Model Interpretation . . . . . . . . . . . . . . . . . . . . . . . . . . . . . . 246

Model Performance . . . . . . . . . . . . . . . . . . . . . . . . . . . . . . . 246

Variable Selection . . . . . . . . . . . . . . . . . . . . . . . . . . . . . . . . 247

10.4 Appendix: Logistic Regression for More Than Two Classes . . . . . . . . . . . . . 250

Problems . . . . . . . . . . . . . . . . . . . . . . . . . . . . . . . . . . . . . . . . 253

CHAPTER 11 Neural Nets 257

11.1 Introduction . . . . . . . . . . . . . . . . . . . . . . . . . . . . . . . . . . . 257

11.2 Concept and Structure of a Neural Network . . . . . . . . . . . . . . . . . . . . 258

11.3 Fitting a Network to Data . . . . . . . . . . . . . . . . . . . . . . . . . . . . 259

Example 1: Tiny Dataset . . . . . . . . . . . . . . . . . . . . . . . . . . . . . 259

Computing Output of Nodes . . . . . . . . . . . . . . . . . . . . . . . . . . . 260

Preprocessing the Data . . . . . . . . . . . . . . . . . . . . . . . . . . . . . 263

Training the Model . . . . . . . . . . . . . . . . . . . . . . . . . . . . . . . . 264

11.4 Required User Input for Training a Network . . . . . . . . . . . . . . . . . . . 267

Example 2: Classifying Accident Severity . . . . . . . . . . . . . . . . . . . . . 269

11.5 Model Validation and Use . . . . . . . . . . . . . . . . . . . . . . . . . . . . 272

Avoiding Overfitting . . . . . . . . . . . . . . . . . . . . . . . . . . . . . . . 272

Using the Output for Prediction and Classification . . . . . . . . . . . . . . . . 273

xii CONTENTS

11.6 Deep Learning . . . . . . . . . . . . . . . . . . . . . . . . . . . . . . . . . . 273

Convolutional Neural Networks (CNNs) . . . . . . . . . . . . . . . . . . . . . . 274

Local Feature Map . . . . . . . . . . . . . . . . . . . . . . . . . . . . . . . . 276

A Hierarchy of Features . . . . . . . . . . . . . . . . . . . . . . . . . . . . . 276

The Learning Process . . . . . . . . . . . . . . . . . . . . . . . . . . . . . . 276

Unsupervised Learning . . . . . . . . . . . . . . . . . . . . . . . . . . . . . . 277

Conclusion . . . . . . . . . . . . . . . . . . . . . . . . . . . . . . . . . . . 278

11.7 Advantages and Weaknesses of Neural Networks . . . . . . . . . . . . . . . . . 279

Problems . . . . . . . . . . . . . . . . . . . . . . . . . . . . . . . . . . . . . . . . 280

CHAPTER 12 Discriminant Analysis 283

12.1 Introduction . . . . . . . . . . . . . . . . . . . . . . . . . . . . . . . . . . . 283

Example 1: Riding Mowers . . . . . . . . . . . . . . . . . . . . . . . . . . . . 284

Example 2: Personal Loan Acceptance . . . . . . . . . . . . . . . . . . . . . . 284

12.2 Distance of an Observation from a Class . . . . . . . . . . . . . . . . . . . . . 286

12.3 Fisher’s Linear Classification Functions . . . . . . . . . . . . . . . . . . . . . . 287

12.4 Classification Performance of Discriminant Analysis . . . . . . . . . . . . . . . 291

12.5 Prior Probabilities . . . . . . . . . . . . . . . . . . . . . . . . . . . . . . . . 292

12.6 Unequal Misclassification Costs . . . . . . . . . . . . . . . . . . . . . . . . . 293

12.7 Classifying More Than Two Classes . . . . . . . . . . . . . . . . . . . . . . . . 293

Example 3: Medical Dispatch to Accident Scenes . . . . . . . . . . . . . . . . . 293

12.8 Advantages and Weaknesses . . . . . . . . . . . . . . . . . . . . . . . . . . . 297

Problems . . . . . . . . . . . . . . . . . . . . . . . . . . . . . . . . . . . . . . . . 299

CHAPTER 13 Generating, Comparing, and Combining

Multiple Models

303

13.1 Ensembles . . . . . . . . . . . . . . . . . . . . . . . . . . . . . . . . . . . . 304

Why Ensembles Can Improve Predictive Power . . . . . . . . . . . . . . . . . . 304

Simple Averaging or Voting . . . . . . . . . . . . . . . . . . . . . . . . . . . 306

Bagging . . . . . . . . . . . . . . . . . . . . . . . . . . . . . . . . . . . . . 307

Boosting . . . . . . . . . . . . . . . . . . . . . . . . . . . . . . . . . . . . 307

Bagging and Boosting in ASDM . . . . . . . . . . . . . . . . . . . . . . . . . 307

Advantages and Weaknesses of Ensembles . . . . . . . . . . . . . . . . . . . . 308

13.2 Automated Machine Learning (AutoML) . . . . . . . . . . . . . . . . . . . . . 309

AutoML: Explore and Clean Data . . . . . . . . . . . . . . . . . . . . . . . . . 310

AutoML: Determine Machine Learning Task . . . . . . . . . . . . . . . . . . . . 310

AutoML: Choose Features and Machine Learning Methods . . . . . . . . . . . . . 310

AutoML: Evaluate Model Performance . . . . . . . . . . . . . . . . . . . . . . 312

AutoML: Model Deployment . . . . . . . . . . . . . . . . . . . . . . . . . . . 313

Advantages and Weaknesses of Automated Machine Learning . . . . . . . . . . . 313

13.3 Summary . . . . . . . . . . . . . . . . . . . . . . . . . . . . . . . . . . . . 314

Problems . . . . . . . . . . . . . . . . . . . . . . . . . . . . . . . . . . . . . . . . 315

CONTENTS xiii

PART V INTERVENTION AND USER FEEDBACK

CHAPTER 14 Experiments, Uplift Modeling, and Reinforcement

Learning

319

14.1 A/B Testing . . . . . . . . . . . . . . . . . . . . . . . . . . . . . . . . . . . 319

Example: Testing a New Feature in a Photo Sharing App . . . . . . . . . . . . . 321

The Statistical Test for Comparing Two Groups (t-test) . . . . . . . . . . . . . . 322

Multiple Treatment Groups: A/B/n tests . . . . . . . . . . . . . . . . . . . . . 324

Multiple A/B Tests and the Danger of Multiple Testing . . . . . . . . . . . . . . 324

14.2 Uplift (Persuasion) Modeling . . . . . . . . . . . . . . . . . . . . . . . . . . . 325

Gathering the Data . . . . . . . . . . . . . . . . . . . . . . . . . . . . . . . 326

A Simple Model . . . . . . . . . . . . . . . . . . . . . . . . . . . . . . . . . 327

Modeling Individual Uplift . . . . . . . . . . . . . . . . . . . . . . . . . . . . 328

Using the Results of an Uplift Model . . . . . . . . . . . . . . . . . . . . . . . 330

14.3 Reinforcement Learning . . . . . . . . . . . . . . . . . . . . . . . . . . . . . 330

Explore-Exploit: Multi-Armed Bandits . . . . . . . . . . . . . . . . . . . . . . 331

Markov Decision Process (MDP) . . . . . . . . . . . . . . . . . . . . . . . . . 333

14.4 Summary . . . . . . . . . . . . . . . . . . . . . . . . . . . . . . . . . . . . 335

Problems . . . . . . . . . . . . . . . . . . . . . . . . . . . . . . . . . . . . . . . . 337

PART VI MINING RELATIONSHIPS AMONG RECORDS

CHAPTER 15 Association Rules and Collaborative Filtering 341

15.1 Association Rules . . . . . . . . . . . . . . . . . . . . . . . . . . . . . . . . 341

Discovering Association Rules in Transaction Databases . . . . . . . . . . . . . 342

Example 1: Synthetic Data on Purchases of Phone Faceplates . . . . . . . . . . 342

Generating Candidate Rules . . . . . . . . . . . . . . . . . . . . . . . . . . . 343

The Apriori Algorithm . . . . . . . . . . . . . . . . . . . . . . . . . . . . . . 345

Selecting Strong Rules . . . . . . . . . . . . . . . . . . . . . . . . . . . . . . 345

Data Format . . . . . . . . . . . . . . . . . . . . . . . . . . . . . . . . . . . 347

The Process of Rule Selection . . . . . . . . . . . . . . . . . . . . . . . . . . 348

Interpreting the Results . . . . . . . . . . . . . . . . . . . . . . . . . . . . . 350

Rules and Chance . . . . . . . . . . . . . . . . . . . . . . . . . . . . . . . . 350

Example 2: Rules for Similar Book Purchases . . . . . . . . . . . . . . . . . . . 352

15.2 Collaborative Filtering . . . . . . . . . . . . . . . . . . . . . . . . . . . . . . 354

Data Type and Format . . . . . . . . . . . . . . . . . . . . . . . . . . . . . . 355

Example 3: Netflix Prize Contest . . . . . . . . . . . . . . . . . . . . . . . . . 355

User-Based Collaborative Filtering: “People Like You” . . . . . . . . . . . . . . 357

Item-Based Collaborative Filtering . . . . . . . . . . . . . . . . . . . . . . . . 359

Advantages and Weaknesses of Collaborative Filtering . . . . . . . . . . . . . . 360

Collaborative Filtering vs. Association Rules . . . . . . . . . . . . . . . . . . . 361

15.3 Summary . . . . . . . . . . . . . . . . . . . . . . . . . . . . . . . . . . . . 362

Problems . . . . . . . . . . . . . . . . . . . . . . . . . . . . . . . . . . . . . . . . 364

xiv CONTENTS

CHAPTER 16 Cluster Analysis 369

16.1 Introduction . . . . . . . . . . . . . . . . . . . . . . . . . . . . . . . . . . . 369

Example: Public Utilities . . . . . . . . . . . . . . . . . . . . . . . . . . . . . 371

16.2 Measuring Distance Between Two Observations . . . . . . . . . . . . . . . . . . 373

Euclidean Distance . . . . . . . . . . . . . . . . . . . . . . . . . . . . . . . 373

Normalizing Numerical Variables . . . . . . . . . . . . . . . . . . . . . . . . . 373

Other Distance Measures for Numerical Data . . . . . . . . . . . . . . . . . . . 375

Distance Measures for Categorical Data . . . . . . . . . . . . . . . . . . . . . . 376

Distance Measures for Mixed Data . . . . . . . . . . . . . . . . . . . . . . . . 377

16.3 Measuring Distance Between Two Clusters . . . . . . . . . . . . . . . . . . . . 377

16.4 Hierarchical (Agglomerative) Clustering . . . . . . . . . . . . . . . . . . . . . 380

Single Linkage . . . . . . . . . . . . . . . . . . . . . . . . . . . . . . . . . . 380

Complete Linkage . . . . . . . . . . . . . . . . . . . . . . . . . . . . . . . . 381

Average Linkage . . . . . . . . . . . . . . . . . . . . . . . . . . . . . . . . . 381

Centroid Linkage . . . . . . . . . . . . . . . . . . . . . . . . . . . . . . . . . 382

Dendrograms: Displaying Clustering Process and Results . . . . . . . . . . . . . 383

Validating Clusters . . . . . . . . . . . . . . . . . . . . . . . . . . . . . . . . 385

Limitations of Hierarchical Clustering . . . . . . . . . . . . . . . . . . . . . . 387

16.5 Non-hierarchical Clustering: The k-Means Algorithm . . . . . . . . . . . . . . . 389

Initial Partition into k Clusters . . . . . . . . . . . . . . . . . . . . . . . . . 391

Problems . . . . . . . . . . . . . . . . . . . . . . . . . . . . . . . . . . . . . . . . 395

PART VII FORECASTING TIME SERIES

CHAPTER 17 Handling Time Series 401

17.1 Introduction . . . . . . . . . . . . . . . . . . . . . . . . . . . . . . . . . . . 401

17.2 Descriptive vs. Predictive Modeling . . . . . . . . . . . . . . . . . . . . . . . 403

17.3 Popular Forecasting Methods in Business . . . . . . . . . . . . . . . . . . . . . 403

Combining Methods . . . . . . . . . . . . . . . . . . . . . . . . . . . . . . . 403

17.4 Time Series Components . . . . . . . . . . . . . . . . . . . . . . . . . . . . . 404

Example: Ridership on Amtrak Trains . . . . . . . . . . . . . . . . . . . . . . . 404

17.5 Data Partitioning and Performance Evaluation . . . . . . . . . . . . . . . . . . 408

Benchmark Performance: Naive Forecasts . . . . . . . . . . . . . . . . . . . . . 409

Generating Future Forecasts . . . . . . . . . . . . . . . . . . . . . . . . . . . 410

Problems . . . . . . . . . . . . . . . . . . . . . . . . . . . . . . . . . . . . . . . . 412

CHAPTER 18 Regression-Based Forecasting 415

18.1 A Model with Trend . . . . . . . . . . . . . . . . . . . . . . . . . . . . . . . 415

Linear Trend . . . . . . . . . . . . . . . . . . . . . . . . . . . . . . . . . . . 415

Exponential Trend . . . . . . . . . . . . . . . . . . . . . . . . . . . . . . . . 418

Polynomial Trend . . . . . . . . . . . . . . . . . . . . . . . . . . . . . . . . 419

CONTENTS xv

18.2 A Model with Seasonality . . . . . . . . . . . . . . . . . . . . . . . . . . . . 420

18.3 A Model with Trend and Seasonality . . . . . . . . . . . . . . . . . . . . . . . 423

18.4 Autocorrelation and ARIMA Models . . . . . . . . . . . . . . . . . . . . . . . . 425

Computing Autocorrelation . . . . . . . . . . . . . . . . . . . . . . . . . . . 425

Improving Forecasts by Integrating Autocorrelation Information . . . . . . . . . 428

Evaluating Predictability . . . . . . . . . . . . . . . . . . . . . . . . . . . . . 431

Problems . . . . . . . . . . . . . . . . . . . . . . . . . . . . . . . . . . . . . . . . 434

CHAPTER 19 Smoothing Methods 445

19.1 Introduction . . . . . . . . . . . . . . . . . . . . . . . . . . . . . . . . . . . 445

19.2 Moving Average . . . . . . . . . . . . . . . . . . . . . . . . . . . . . . . . . 446

Centered Moving Average for Visualization . . . . . . . . . . . . . . . . . . . . 446

Trailing Moving Average for Forecasting . . . . . . . . . . . . . . . . . . . . . 447

Choosing Window Width (w) . . . . . . . . . . . . . . . . . . . . . . . . . . . 449

19.3 Simple Exponential Smoothing . . . . . . . . . . . . . . . . . . . . . . . . . . 451

Choosing Smoothing Parameter α . . . . . . . . . . . . . . . . . . . . . . . . 452

Relation Between Moving Average and Simple Exponential Smoothing . . . . . . 453

19.4 Advanced Exponential Smoothing . . . . . . . . . . . . . . . . . . . . . . . . 453

Series with a Trend . . . . . . . . . . . . . . . . . . . . . . . . . . . . . . . 454

Series with a Trend and Seasonality . . . . . . . . . . . . . . . . . . . . . . . 454

Series with Seasonality (No Trend) . . . . . . . . . . . . . . . . . . . . . . . . 455

Problems . . . . . . . . . . . . . . . . . . . . . . . . . . . . . . . . . . . . . . . . 457

PART VIII DATA ANALYTICS

CHAPTER 20 Social Network Analytics 467

20.1 Introduction . . . . . . . . . . . . . . . . . . . . . . . . . . . . . . . . . . . 467

20.2 Directed vs. Undirected Networks . . . . . . . . . . . . . . . . . . . . . . . . 468

20.3 Visualizing and Analyzing Networks . . . . . . . . . . . . . . . . . . . . . . . 469

Plot Layout . . . . . . . . . . . . . . . . . . . . . . . . . . . . . . . . . . . 470

Adjacency List . . . . . . . . . . . . . . . . . . . . . . . . . . . . . . . . . . 472

Adjacency Matrix . . . . . . . . . . . . . . . . . . . . . . . . . . . . . . . . 472

Using Network Data in Classification and Prediction . . . . . . . . . . . . . . . 473

20.4 Social Data Metrics and Taxonomy . . . . . . . . . . . . . . . . . . . . . . . . 473

Node-Level Centrality Metrics . . . . . . . . . . . . . . . . . . . . . . . . . . 474

Egocentric Network . . . . . . . . . . . . . . . . . . . . . . . . . . . . . . . 475

Network Metrics . . . . . . . . . . . . . . . . . . . . . . . . . . . . . . . . . 475

20.5 Using Network Metrics in Prediction and Classification . . . . . . . . . . . . . . 478

Link Prediction . . . . . . . . . . . . . . . . . . . . . . . . . . . . . . . . . 478

Entity Resolution . . . . . . . . . . . . . . . . . . . . . . . . . . . . . . . . 479

Collaborative Filtering . . . . . . . . . . . . . . . . . . . . . . . . . . . . . . 481

20.6 Advantages and Disadvantages . . . . . . . . . . . . . . . . . . . . . . . . . 484

Problems . . . . . . . . . . . . . . . . . . . . . . . . . . . . . . . . . . . . . . . . 486

xvi CONTENTS

CHAPTER 21 Text Mining 487

21.1 Introduction . . . . . . . . . . . . . . . . . . . . . . . . . . . . . . . . . . . 487

21.2 The Spreadsheet Representation of Text: Term-Document Matrix

and “Bag-of-Words ” . . . . . . . . . . . . . . . . . . . . . . . . . . . . . . 488

21.3 Bag-of-Words vs. Meaning Extraction at Document Level . . . . . . . . . . . . . 489

21.4 Preprocessing the Text . . . . . . . . . . . . . . . . . . . . . . . . . . . . . . 490

Tokenization . . . . . . . . . . . . . . . . . . . . . . . . . . . . . . . . . . . 490

Text Reduction . . . . . . . . . . . . . . . . . . . . . . . . . . . . . . . . . 491

Presence/Absence vs. Frequency . . . . . . . . . . . . . . . . . . . . . . . . . 494

Term Frequency - Inverse Document Frequency (TF-IDF) . . . . . . . . . . . . . 494

From Terms to Concepts: Latent Semantic Indexing . . . . . . . . . . . . . . . . 495

Extracting Meaning . . . . . . . . . . . . . . . . . . . . . . . . . . . . . . . 497

From Terms to High Dimensional Word Vectors: Word2Vec . . . . . . . . . . . . . 497

21.5 Implementing Machine Learning Methods . . . . . . . . . . . . . . . . . . . . 497

21.6 Example: Online Discussions on Autos and Electronics . . . . . . . . . . . . . . 498

Importing and Labeling the Records . . . . . . . . . . . . . . . . . . . . . . . 498

Tokenization . . . . . . . . . . . . . . . . . . . . . . . . . . . . . . . . . . . 499

Text Processing and Reduction . . . . . . . . . . . . . . . . . . . . . . . . . . 499

Producing a Concept Matrix . . . . . . . . . . . . . . . . . . . . . . . . . . . 500

Labeling the Documents . . . . . . . . . . . . . . . . . . . . . . . . . . . . . 500

Fitting a Model . . . . . . . . . . . . . . . . . . . . . . . . . . . . . . . . . 501

Prediction . . . . . . . . . . . . . . . . . . . . . . . . . . . . . . . . . . . . 502

21.7 Summary . . . . . . . . . . . . . . . . . . . . . . . . . . . . . . . . . . . . 502

Problems . . . . . . . . . . . . . . . . . . . . . . . . . . . . . . . . . . . . . . . . 504

CHAPTER 22 Responsible Data Science 507

22.1 Introduction . . . . . . . . . . . . . . . . . . . . . . . . . . . . . . . . . . . 507

22.2 Unintentional Harm . . . . . . . . . . . . . . . . . . . . . . . . . . . . . . . 508

22.3 Legal Considerations . . . . . . . . . . . . . . . . . . . . . . . . . . . . . . . 509

22.4 Principles of Responsible Data Science . . . . . . . . . . . . . . . . . . . . . . 511

Non-maleficence . . . . . . . . . . . . . . . . . . . . . . . . . . . . . . . . . 511

Fairness . . . . . . . . . . . . . . . . . . . . . . . . . . . . . . . . . . . . . 512

Transparency . . . . . . . . . . . . . . . . . . . . . . . . . . . . . . . . . . 513

Accountability . . . . . . . . . . . . . . . . . . . . . . . . . . . . . . . . . . 514

Data Privacy and Security . . . . . . . . . . . . . . . . . . . . . . . . . . . . 514

22.5 A Responsible Data Science Framework . . . . . . . . . . . . . . . . . . . . . . 514

Justification . . . . . . . . . . . . . . . . . . . . . . . . . . . . . . . . . . . 514

Assembly . . . . . . . . . . . . . . . . . . . . . . . . . . . . . . . . . . . . 515

Data Preparation . . . . . . . . . . . . . . . . . . . . . . . . . . . . . . . . 516

Modeling . . . . . . . . . . . . . . . . . . . . . . . . . . . . . . . . . . . . 517

Auditing . . . . . . . . . . . . . . . . . . . . . . . . . . . . . . . . . . . . . 517

22.6 Documentation Tools . . . . . . . . . . . . . . . . . . . . . . . . . . . . . . 518

Impact Statements . . . . . . . . . . . . . . . . . . . . . . . . . . . . . . . 518

Model Cards . . . . . . . . . . . . . . . . . . . . . . . . . . . . . . . . . . . 519

Datasheets . . . . . . . . . . . . . . . . . . . . . . . . . . . . . . . . . . . 520

CONTENTS xvii

Audit Reports . . . . . . . . . . . . . . . . . . . . . . . . . . . . . . . . . . 520

22.7 Example: Applying the RDS Framework to the COMPAS Example . . . . . . . . . . 522

Unanticipated Uses . . . . . . . . . . . . . . . . . . . . . . . . . . . . . . . 522

Ethical Concerns . . . . . . . . . . . . . . . . . . . . . . . . . . . . . . . . . 522

Protected Groups . . . . . . . . . . . . . . . . . . . . . . . . . . . . . . . . 522

Data Issues . . . . . . . . . . . . . . . . . . . . . . . . . . . . . . . . . . . 523

Fitting the Model . . . . . . . . . . . . . . . . . . . . . . . . . . . . . . . . 523

Auditing the Model . . . . . . . . . . . . . . . . . . . . . . . . . . . . . . . 524

Bias Mitigation . . . . . . . . . . . . . . . . . . . . . . . . . . . . . . . . . 530

22.8 Summary . . . . . . . . . . . . . . . . . . . . . . . . . . . . . . . . . . . . 531

Problems . . . . . . . . . . . . . . . . . . . . . . . . . . . . . . . . . . . . . . . . 532

PART IX CASES

CHAPTER 23 Cases 537

23.1 Charles Book Club . . . . . . . . . . . . . . . . . . . . . . . . . . . . . . . . 537

The Book Industry . . . . . . . . . . . . . . . . . . . . . . . . . . . . . . . . 537

Database Marketing at Charles . . . . . . . . . . . . . . . . . . . . . . . . . . 538

Machine Learning Techniques . . . . . . . . . . . . . . . . . . . . . . . . . . 540

Assignment . . . . . . . . . . . . . . . . . . . . . . . . . . . . . . . . . . . 544

23.2 German Credit . . . . . . . . . . . . . . . . . . . . . . . . . . . . . . . . . . 546

Background . . . . . . . . . . . . . . . . . . . . . . . . . . . . . . . . . . . 546

Data . . . . . . . . . . . . . . . . . . . . . . . . . . . . . . . . . . . . . . . 546

Assignment . . . . . . . . . . . . . . . . . . . . . . . . . . . . . . . . . . . 547

23.3 Tayko Software Cataloger . . . . . . . . . . . . . . . . . . . . . . . . . . . . 551

Background . . . . . . . . . . . . . . . . . . . . . . . . . . . . . . . . . . . 551

The Mailing Experiment . . . . . . . . . . . . . . . . . . . . . . . . . . . . . 551

Data . . . . . . . . . . . . . . . . . . . . . . . . . . . . . . . . . . . . . . . 551

Assignment . . . . . . . . . . . . . . . . . . . . . . . . . . . . . . . . . . . 553

23.4 Political Persuasion . . . . . . . . . . . . . . . . . . . . . . . . . . . . . . . 555

Background . . . . . . . . . . . . . . . . . . . . . . . . . . . . . . . . . . . 555

Predictive Analytics Arrives in US Politics . . . . . . . . . . . . . . . . . . . . 555

Political Targeting . . . . . . . . . . . . . . . . . . . . . . . . . . . . . . . . 555

Uplift . . . . . . . . . . . . . . . . . . . . . . . . . . . . . . . . . . . . . . 556

Data . . . . . . . . . . . . . . . . . . . . . . . . . . . . . . . . . . . . . . . 557

Assignment . . . . . . . . . . . . . . . . . . . . . . . . . . . . . . . . . . . 557

23.5 Taxi Cancellations . . . . . . . . . . . . . . . . . . . . . . . . . . . . . . . . 559

Business Situation . . . . . . . . . . . . . . . . . . . . . . . . . . . . . . . . 559

Assignment . . . . . . . . . . . . . . . . . . . . . . . . . . . . . . . . . . . 559

23.6 Segmenting Consumers of Bath Soap . . . . . . . . . . . . . . . . . . . . . . . 561

Business Situation . . . . . . . . . . . . . . . . . . . . . . . . . . . . . . . . 561

Key Problems . . . . . . . . . . . . . . . . . . . . . . . . . . . . . . . . . . 561

Data . . . . . . . . . . . . . . . . . . . . . . . . . . . . . . . . . . . . . . . 562

Measuring Brand Loyalty . . . . . . . . . . . . . . . . . . . . . . . . . . . . . 562

Assignment . . . . . . . . . . . . . . . . . . . . . . . . . . . . . . . . . . . 562

xviii CONTENTS

23.7 Direct-Mail Fundraising . . . . . . . . . . . . . . . . . . . . . . . . . . . . . 565

Background . . . . . . . . . . . . . . . . . . . . . . . . . . . . . . . . . . . 565

Data . . . . . . . . . . . . . . . . . . . . . . . . . . . . . . . . . . . . . . . 565

Assignment . . . . . . . . . . . . . . . . . . . . . . . . . . . . . . . . . . . 565

23.8 Catalog Cross-Selling . . . . . . . . . . . . . . . . . . . . . . . . . . . . . . 568

Background . . . . . . . . . . . . . . . . . . . . . . . . . . . . . . . . . . . 568

Assignment . . . . . . . . . . . . . . . . . . . . . . . . . . . . . . . . . . . 568

23.9 Time Series Case: Forecasting Public Transportation Demand . . . . . . . . . . . 570

Background . . . . . . . . . . . . . . . . . . . . . . . . . . . . . . . . . . . 570

Problem Description . . . . . . . . . . . . . . . . . . . . . . . . . . . . . . . 570

Available Data . . . . . . . . . . . . . . . . . . . . . . . . . . . . . . . . . . 570

Assignment Goal . . . . . . . . . . . . . . . . . . . . . . . . . . . . . . . . . 570

Assignment . . . . . . . . . . . . . . . . . . . . . . . . . . . . . . . . . . . 571

Tips and Suggested Steps . . . . . . . . . . . . . . . . . . . . . . . . . . . . 571

23.10 Loan Approval . . . . . . . . . . . . . . . . . . . . . . . . . . . . . . . . . . 572

Background . . . . . . . . . . . . . . . . . . . . . . . . . . . . . . . . . . . 572

Regulatory Requirements . . . . . . . . . . . . . . . . . . . . . . . . . . . . 572

Getting Started . . . . . . . . . . . . . . . . . . . . . . . . . . . . . . . . . 572

Assignment . . . . . . . . . . . . . . . . . . . . . . . . . . . . . . . . . . . 573

References 575

Data Files Used in the Book 577

Index 579

Supplemental Materials

What is included with this book?

The New copy of this book will include any supplemental materials advertised. Please check the title of the book to determine if it should include any access cards, study guides, lab manuals, CDs, etc.

The Used, Rental and eBook copies of this book are not guaranteed to include any supplemental materials. Typically, only the book itself is included. This is true even if the title states it includes any access cards, study guides, lab manuals, CDs, etc.

Rewards Program