rent-now

Rent More, Save More! Use code: ECRENTAL

5% off 1 book, 7% off 2 books, 10% off 3+ books

9780387950532

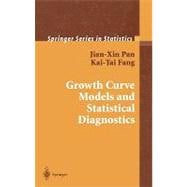
Growth Curve Models With Statistical Diagnostics

by ; ;
  • ISBN13:

    9780387950532

  • ISBN10:

    0387950532

  • Format: Hardcover
  • Copyright: 2002-09-01
  • Publisher: Springer Verlag
  • Purchase Benefits
  • Free Shipping Icon Free Shipping On Orders Over $35!
    Your order must be $35 or more to qualify for free economy shipping. Bulk sales, PO's, Marketplace items, eBooks and apparel do not qualify for this offer.
  • eCampus.com Logo Get Rewarded for Ordering Your Textbooks! Enroll Now
List Price: $169.99 Save up to $134.35
  • Digital
    $77.22*
    Add to Cart

    DURATION
    PRICE
    *To support the delivery of the digital material to you, a digital delivery fee of $3.99 will be charged on each digital item.

Summary

Growth-curve models are generalized multivariate analysis-of-variance models. The basic idea of the models is to use different polynomials to fit different treatment groups involved in the longitudinal study. It is not uncommon, however, to find outliers and influential observations in growth data that heavily affect statistical inference in growth curve models. This book provides a comprehensive introduction to the theory of growth curve models with an emphasis on statistical diagnostics. A variety of issues on model fittings and model diagnostics are addressed, and many criteria for outlier detection and influential observation identification are created within likelihood and Bayesian frameworks. This book is intended for postgraduates and statisticians whose research involves longitudinal study, multivariate analysis and statistical diagnostics, and also for scientists who analyze longitudinal data and repeated measures. The authors provide theoretical details on the model fittings and also emphasize the application of growth curve models to practical data analysis, which are reflected in the analysis of practical examples given in each chapter. The book assumes a basic knowledge of matrix algebra and linear regression. Jian-Xin Pan is a lecturer in Medical Statistics of Keele University in the U.K. He has published more than twenty papers on growth curve models, statistical diagnostics and linear/non-linear mixed models. He has a long-standing research interest in longitudinal data analysis and repeated measures in medicine and agriculture. Kai-Tai Fang is a chair professor in Statistics of Hong Kong Baptist University and a fellow of the Institute of Mathematical Statistics. He has published several books with Springer-Verlag, Chapman & Hall, and Science Press and is an author or co-author of over one hundred papers. His research interest includes generalized multivariate analysis, elliptically contoured distributions and uniform design.

Author Biography

Jian-Xin Pan is a lecturer in medical statistics at Keele University in the United Kingdom.

Table of Contents

Preface vii
Acronyms xv
Notation xvi
Introduction
1(37)
General Remarks
1(9)
Statistical Diagnostics
1(2)
Outliers and Influential Observation
3(7)
Statistical Diagnostics in Multivariate Analysis
10(6)
Multiple Outliers in Multivariate Data
10(4)
Statistical diagnostics in multivariate models
14(2)
Growth Curve Model (GCM)
16(7)
A Brief Review
16(3)
Covariance Structure Selection
19(4)
Summary
23(5)
Statistical Inference
24(1)
Diagnostics Within a Iikelihood Framework
25(1)
Diagnostics Within a Bayesian Framework
26(2)
Preliminary Results
28(9)
Matrix Operation and Matrix Derivative
28(4)
Matrix-variate Normal and t Distributions
32(5)
Further Readings
37(1)
Generalized Least Square Estimation
38(39)
General Remarks
38(14)
Model Definition
38(7)
Practical Examples
45(7)
Generalized Least Square Estimation
52(16)
Generalized Least Square Estimate (GLSE)
52(6)
Best Linear Unbiased Estimate (BLUE)
58(5)
Illustrative Examples
63(5)
Admissible Estimate of Regression Coefficient
68(6)
Admissibility
68(3)
Necessary and Sufficient Condition
71(3)
Bibliographical Notes
74(3)
Maximum Likelihood Estimation
77(82)
Maximum Likelihood Estimation
77(36)
Maximum Likelihood Estimate (MLE)
77(10)
Expectation and Variance-covariance
87(13)
Illustrative Examples
100(13)
Rao's Simple Covariance Structure (SCS)
113(24)
Condition That the MLE Is Identical to the GLSE
113(6)
Estimates of Dispersion Components
119(11)
Illustrative Examples
130(7)
Restricted Maximum Likelihood Estimation
137(19)
Restricted Maximum Likelihood (REMLs) estimate
137(3)
REMLs Estimates in the GCM
140(12)
Illustrative Examples
152(4)
Bibliographical Notes
156(3)
Discordant Outlier and Influential Observation
159(65)
General Remarks
159(4)
Discordant Outlier-Generating Model
159(2)
Influential Observation
161(2)
Discordant Outlier Detection in the GCM with SCS
163(13)
Multiple Individual Deletion Model (MIDM)
163(2)
Mean Shift Regression Model (MSRM)
165(2)
Multiple Discordant Outlier Detection
167(3)
Illustrative Examples
170(6)
Influential Observation in the GCM with SCS
176(16)
Generalized Cook-type Distance
176(3)
Confidence Ellipsoid's Volume
179(3)
Influence Assessment on Linear Combination
182(3)
Illustrative Examples
185(7)
Discordant Outlier Detection in the GCM with UC
192(15)
Multiple Individual Deletion Model (MIDM)
192(3)
Mean Shift Regression Model (MSRM)
195(3)
Multiple Discordant Outlier Detection
198(6)
Illustrative Examples
204(3)
Influential Observation in the GCM with UC
207(14)
Generalized Cook-type Distance
207(1)
Confidence Ellipsoid's Volume
208(4)
Influence Assessment on Linear Combination
212(3)
Illustrative Examples
215(6)
Bibliographical Notes
221(3)
Likelihood-Based Local Influence
224(40)
General Remarks
224(5)
Background
224(2)
Local Influence Analysis
226(3)
Local Influence Assessment in the GCM with SCS
229(18)
Observed Information Matrix
231(1)
Hessian Matrix
231(5)
Covariance-Weighted Perturbation
236(2)
Illustrative Examples
238(9)
Local Influence Assessment in the GCM with UC
247(15)
Observed Information Matrix
247(2)
Hessian Matrix
249(7)
Covariance-Weighted Perturbation
256(2)
Illustrative Examples
258(4)
Bibliographical Notes
262(2)
Bayesian Influence Assessment
264(44)
General Remarks
264(5)
Bayesian Influence Analysis
264(3)
Kullback-Leibler Divergence
267(2)
Bayesian Influence Analysis in the GCM with SCS
269(17)
Posterior Distribution
269(2)
Bayesian Influence Measurement
271(6)
Illustrative Examples
277(9)
Bayesian Influence Analysis in the GCM with UC
286(19)
Posterior Distribution
286(7)
Bayesian Influence Measurement
293(8)
Illustrative Examples
301(4)
Bibliographical Notes
305(3)
Bayesian Local Influence
308(45)
General Remarks
308(12)
Bayesian Local Influence
308(6)
Bayesian Hessian Matrix
314(6)
Bayesian Local Influence in the GCM with SCS
320(16)
Bayesian Hessian Matrix
320(3)
Covariance-Weighted Perturbation
323(3)
Illustrative Examples
326(10)
Bayesian Local Influence in the GCM with UC
336(15)
Bayesian Hessian Matrix
337(5)
Covariance-Weighted Perturbation
342(5)
Illustrative Examples
347(4)
Bibliographical Notes
351(2)
Appendix Data sets used in this book 353(8)
References 361(17)
Author Index 378(4)
Subject Index 382

Supplemental Materials

What is included with this book?

The New copy of this book will include any supplemental materials advertised. Please check the title of the book to determine if it should include any access cards, study guides, lab manuals, CDs, etc.

The Used, Rental and eBook copies of this book are not guaranteed to include any supplemental materials. Typically, only the book itself is included. This is true even if the title states it includes any access cards, study guides, lab manuals, CDs, etc.

Rewards Program